
What you'll learn
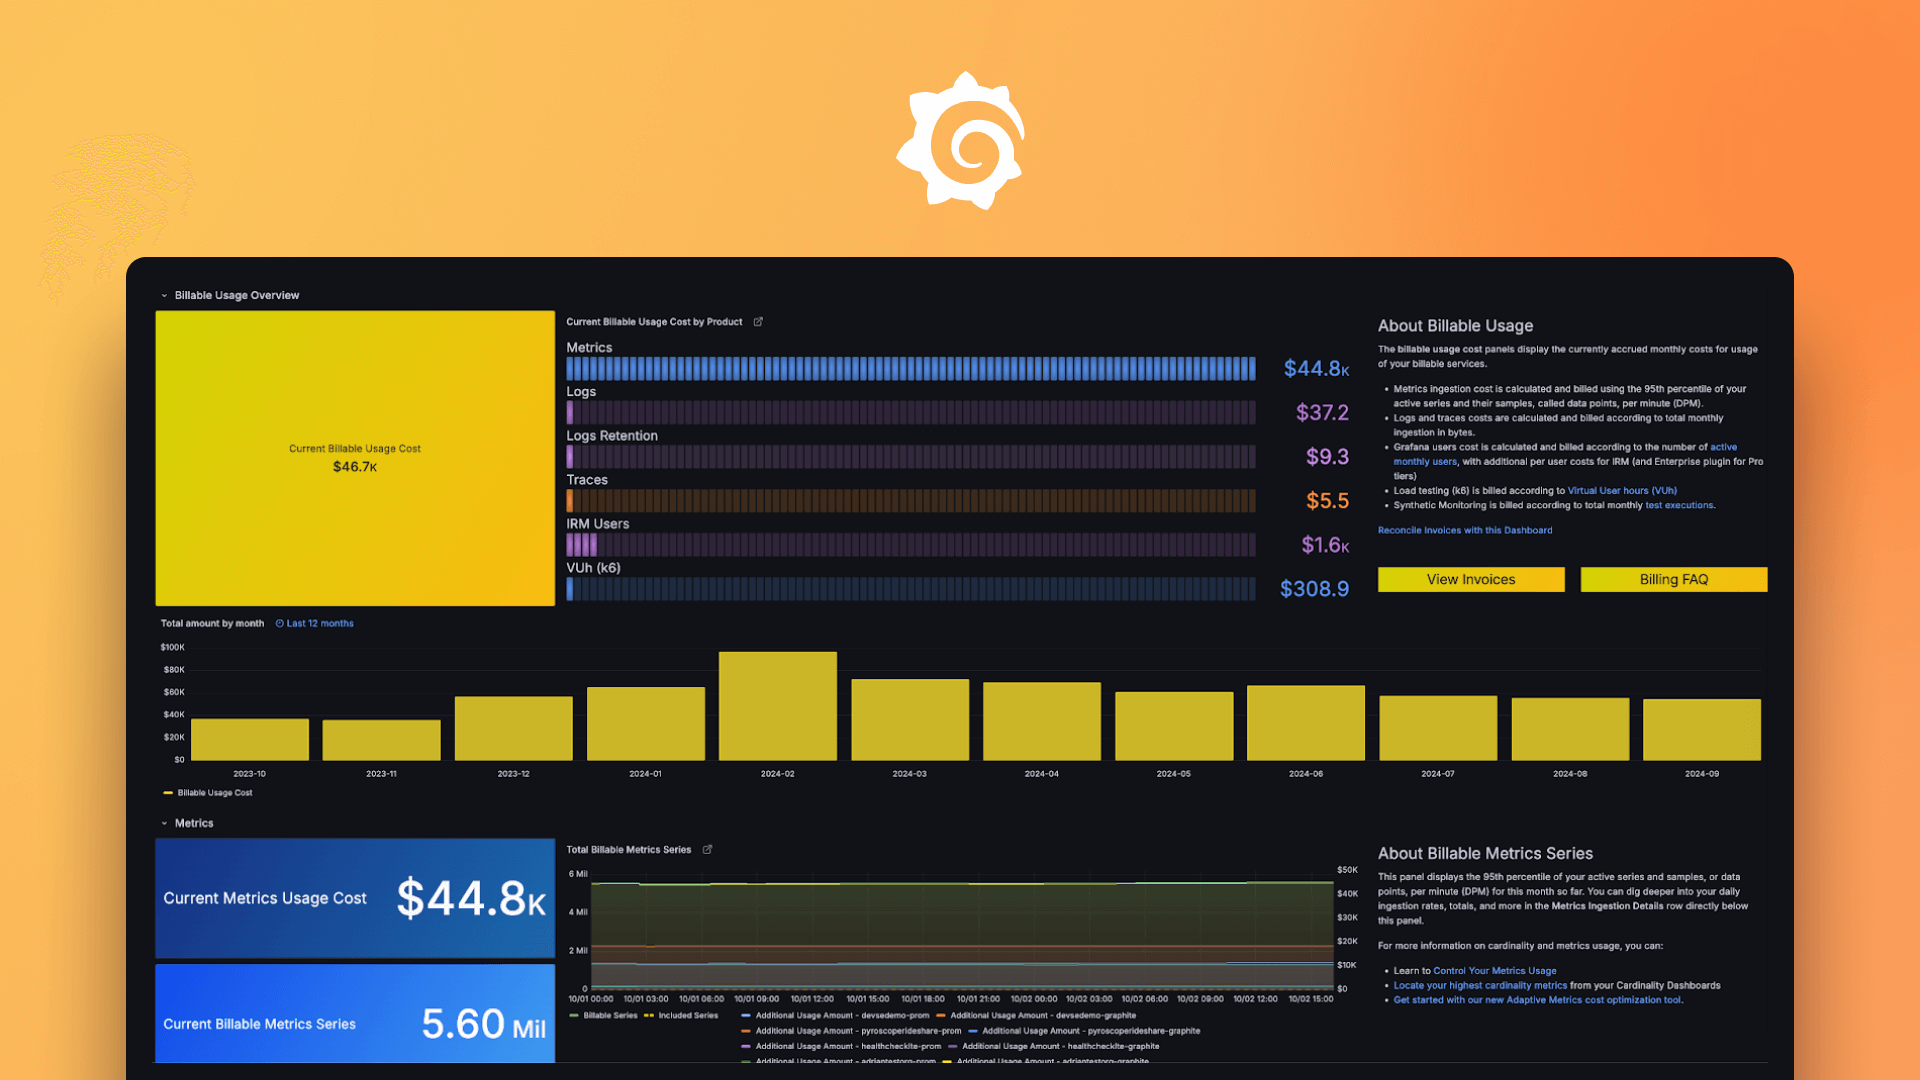
- How to build Grafana dashboards that visualize and track your observability costs in real-time.
- Effective strategies to optimize observability spending using tools like Adaptive Metrics & Logs, Usage Groups, and Attribution Reports.
- How to implement automated recommendations that reduce manual data management and lower overall costs.
- Best practices for setting up alerts to prevent unexpected observability cost spikes.
- How to leverage cost savings to reinvest in additional Grafana observability tools for deeper insights and platform optimization.
Your guides

Brandy Smith
Staff Customer Solutions Engineer

Wei-Chin Call
Senior Solutions Engineer


