Webinar

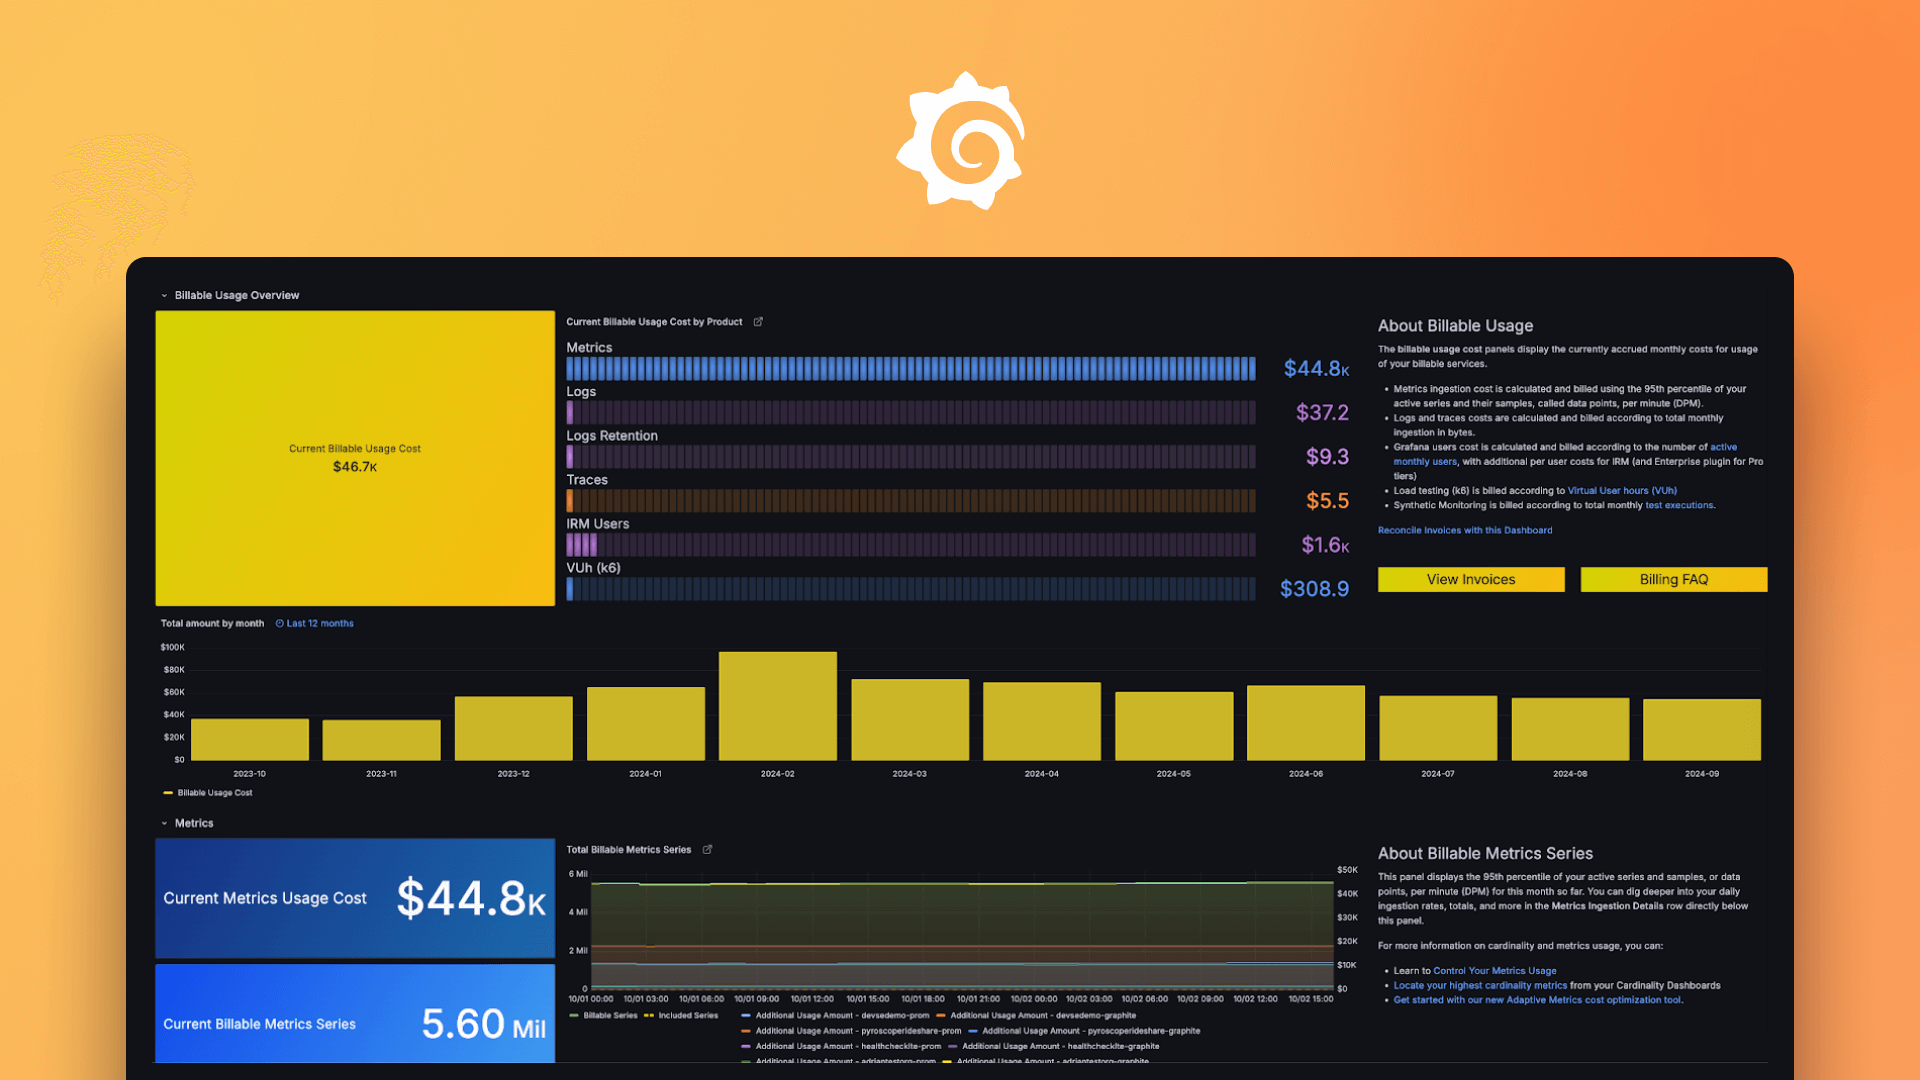
Building a cost optimization dashboard in Grafana Cloud

Sign up for this webinar
Note: By registering, you agree to be emailed information about this event recording and related product-level information.
Sign up for this webinar
Note: By registering, you agree to be emailed information about this event recording and related product-level information.
Join the webinar
Note: By registering, you agree to be emailed information about this event recording and related product-level information.
Get notified about the on-demand recording
Note: By registering, you agree to be emailed information about this event recording and related product-level information.
Register to watch the on-demand recording
Note: By registering, you agree to be emailed information about this event recording and related product-level information.
You are registered for this webinar Thanks for registering
You'll receive an email confirmation, and a reminder on the day of the event. You'll receive an email when the on-demand video is available.
Building a cost optimization dashboard in Grafana Cloud

What you'll learn

  1. How to build Grafana dashboards that visualize and track your observability costs in real-time.
  2. Effective strategies to optimize observability spending using tools like Adaptive Metrics & Logs, Usage Groups, and Attribution Reports.
  3. How to implement automated recommendations that reduce manual data management and lower overall costs.
  4. Best practices for setting up alerts to prevent unexpected observability cost spikes.
  5. How to leverage cost savings to reinvest in additional Grafana observability tools for deeper insights and platform optimization.

Your guides

David Ryder
David Ryder
Principal Solutions Engineer
Brandy Smith
Brandy Smith
Staff Customer Solutions Engineer
Wei-Chin Call
Wei-Chin Call
Senior Solutions Engineer