
What you'll learn
- Examples of common mistakes while monitoring Kubernetes
- How Kubernetes Monitoring can streamline Kubernetes triage
- How Kubernetes Monitoring can help save you money on your infrastructure spend
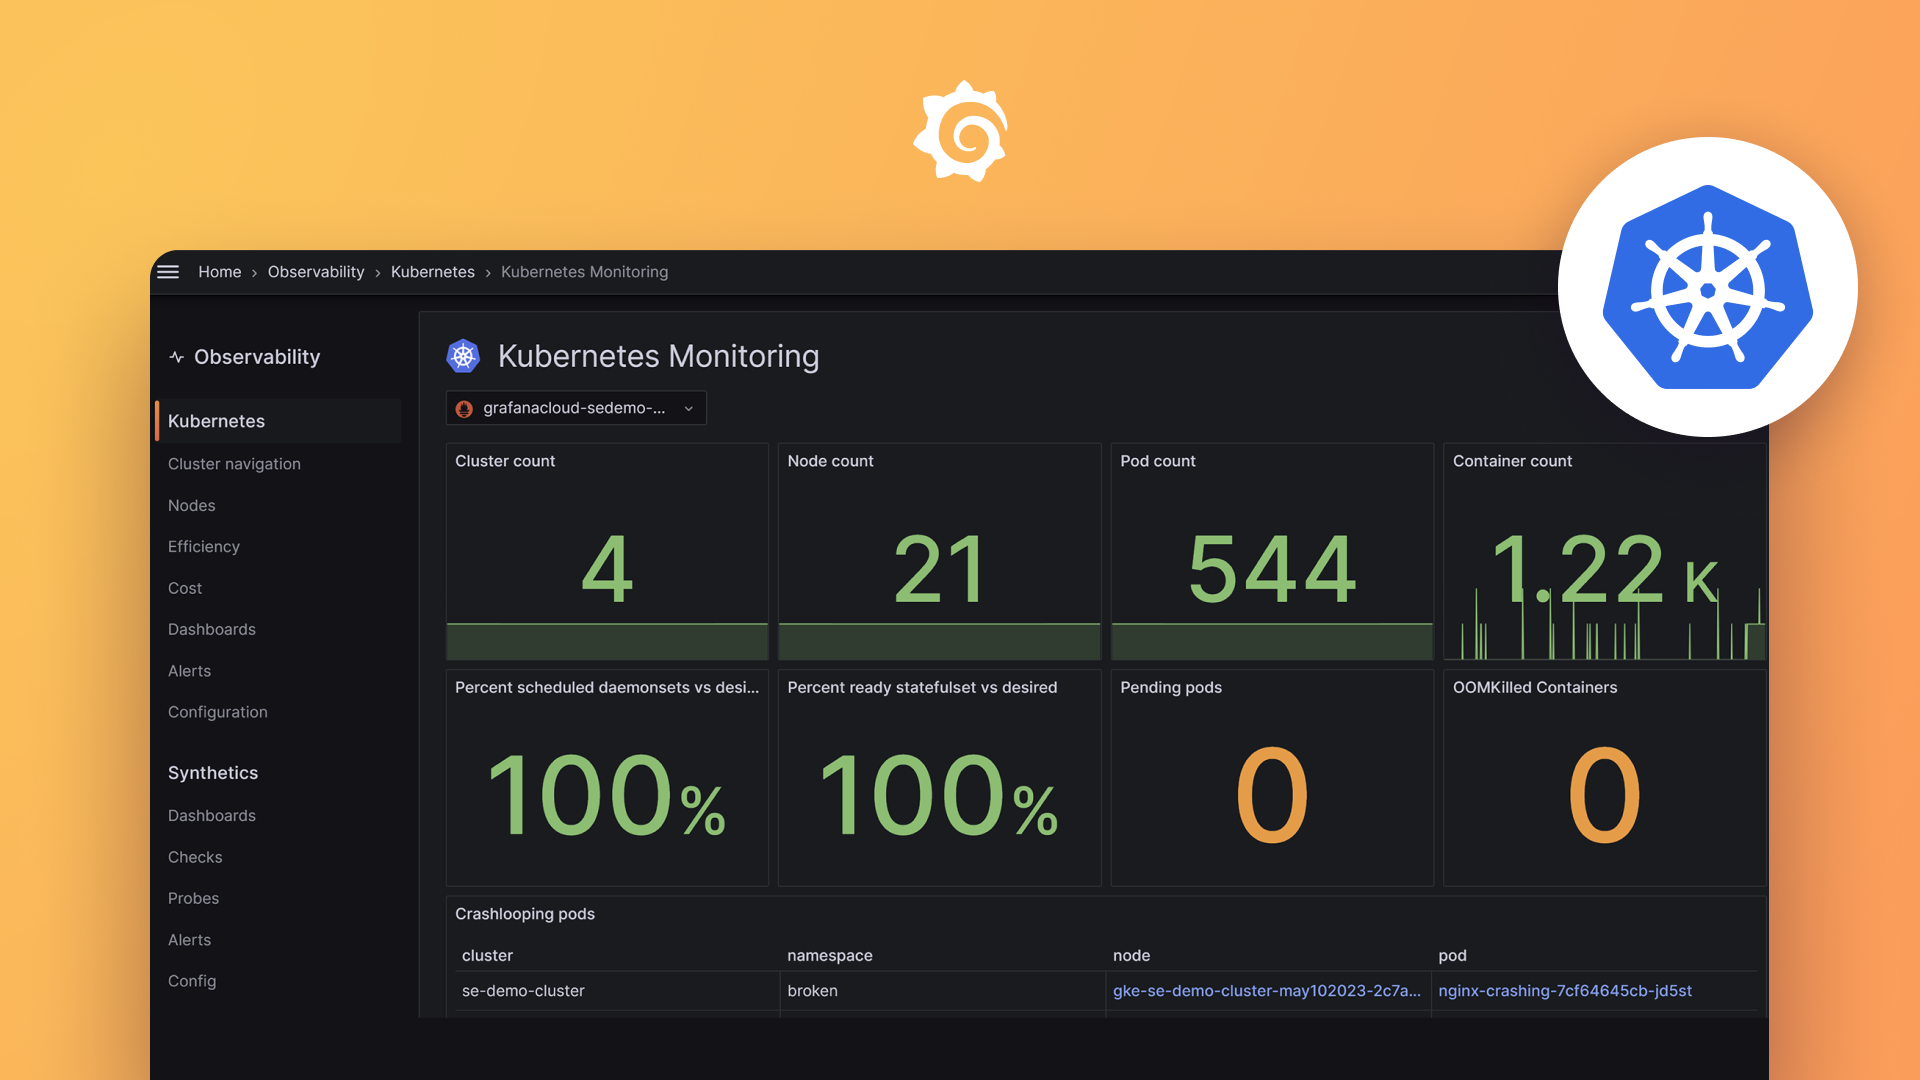
Optimize your Kubernetes monitoring with Grafana Cloud
Which metrics should you collect? What dashboards are best suited to effectively monitor Kubernetes clusters? How do you measure resource utilization for capacity planning and cost reduction? Often, this is all a game of trial and error – and one that business-critical services cannot afford.
Learn how Grafana Cloud’s Kubernetes Monitoring solution was built so you can avoid the guessing game and kickstart your Kubernetes observability strategy in minutes. In this session, we will break down the most common Kubernetes monitoring mistakes and share best practices on how to set up Kubernetes monitoring the optimal way.
Additional resources to explore:
Your guide

Éamon Ryan
Senior Principal Field Engineer


