SailPoint is the identity security company that helps thousands of organizations decide who — and increasingly, what — gets access to which systems. Inside SailPoint, the Periscope observability platform team moves roughly 30 TB of logs a day across its global infrastructure. By bringing its Access Risk Management group onto Grafana Cloud and Grafana Assistant, SailPoint cut auth failure investigations from 2 to 4 hours down to 20 minutes — without forcing the team off the underlying log store it had grown into.
Challenge
When SailPoint acquired the team that would become its Access Risk Management (ARM) practice, it inherited a logging stack built for a smaller company. ARM services wrote to an Azure Service Bus, fed a .NET microservice, and landed in a self-managed SQL Server. The setup worked, but every operational task came with friction. Storage retention had to be configured by hand. Two or three times a year, engineers reduced storage by manually deleting older logs — a process that escalated into a P2 incident on at least one occasion. And because SQL Server is not a logs platform, there was no native way to visualize what the data was telling investigators.
“They had to export logs into Excel,” recalls Juan Carlos Ramirez, the Senior Staff DevOps Engineer who leads Periscope. “It’s just not the place we’d want them to be.”
ARM also sat outside the observability standards Periscope had been rolling out across the rest of SailPoint — Grafana Cloud Metrics for metrics, Grafana Cloud Traces for distributed tracing, Grafana Cloud Profiles for continuous profiling. The team needed a logs path that was clearly better than what ARM already had, not just a mandate from a new parent company.
Solution
Periscope chose a two-part architecture for the new ARM logging stack: ClickHouse Cloud as the columnar log store, with Grafana Cloud as the unified query, visualization, and AI layer on top. To get logs there, the team reused the components it had already standardized across SailPoint — Vector for collection and Cribl for in-flight processing, both aligned to OpenTelemetry semantic conventions.
Rather than force a hard cutover, Periscope built a dual-write bridge: a small custom service tails the existing Azure Service Bus and writes to stdout, where Vector picks it up and ships it through Cribl into ClickHouse Cloud. The original SQL Server pipeline keeps running in parallel until each ARM service is fully validated on the new path.
Once ARM logs were available in Grafana Cloud, the team layered in Grafana Assistant for plain-language querying. The same Grafana Cloud mixed data source capability that powers Periscope’s other dashboards now also surfaces a per-service log cost view — joining AWS Cost Explorer data with the volume metrics Vector emits in Prometheus format, so any cost spike can be attributed to the service that caused it.
Impact
With the new pipeline in place, SailPoint shifted ARM from a siloed, manually-tuned logging stack to a self-service workflow on the same observability platform as the rest of the company:
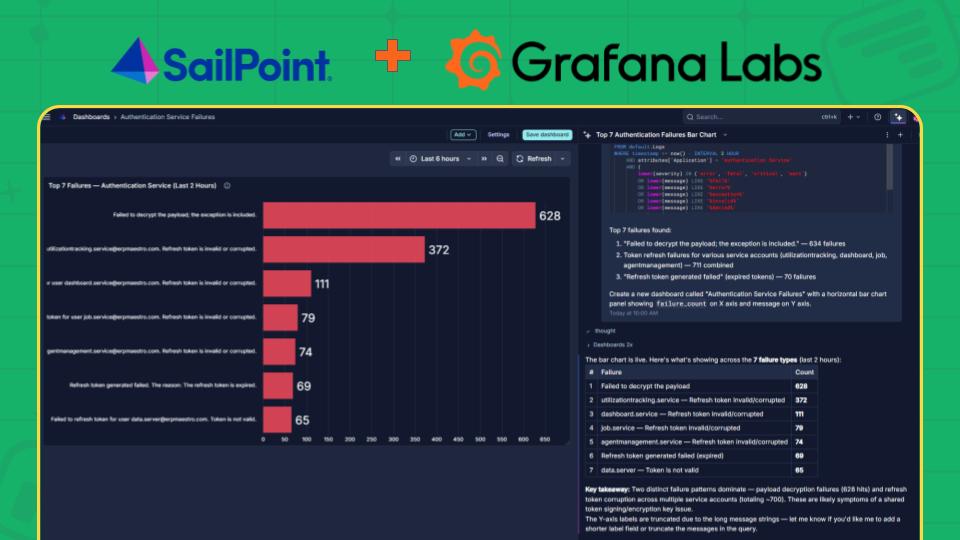
- Auth failure investigations on ARM dropped from 2 to 4 hours to 20 minutes after the team’s first Grafana Assistant-driven analysis
- Spike investigations on Periscope dropped from 15 to 20 minutes to about 5 — without blocking the engineer
- Data ages out automatically, eliminating recurring storage reclamation incidents
- ARM engineers now query in plain English and get auto-generated bar charts instead of exporting logs to Excel
- OpenTelemetry semantic conventions reach ARM by default through the shared Vector + Cribl pipeline
- Periscope can now attribute log cost to individual services and detect cost spikes early
“I can just ask Grafana a question, leave it in that tab, go do something else, get Slack, get some coffee, and come back to a full investigation. It’s personally helped me find spikes in logs before the assistant that would’ve taken me maybe 15, 20 minutes down to maybe five — and that’s while I’m doing other things.”
— Juan Carlos Ramirez, Senior Staff DevOps Engineer, SailPoint
Looking ahead
Periscope is finishing the rollout of remaining ARM services off SQL Server and gathering benchmark data on the migration. Next on the roadmap: anomaly detection on top of the per-service cost view, SLO dashboards for the ARM team, and automated scaling where the pipeline supports it.
Your guide