Visualization topic
A visualization topic provides an overview of a visualization type, its use cases, and the display options available in the user interface (UI). Visualization topics always include conceptual and reference content and may include task content.
The following types of content can be included in visualization topics:
- A high-level overview of a visualization’s features, with use cases
- Descriptions of the UI options unique to that visualization (common options are documented separately)
- Screenshots that help users understand UI interactions or hard-to-describe UI
- As needed, guidance on how to use the visualization in special use cases
- Best practice guidelines
A visualization topic doesn’t include:
- Tutorial content
Most visualizations require a data source; the ones that don’t are called widgets. As a result, a widget requires less documentation than a typical visualization. The structures for both of these are explained in the following sections:
Visualization topic structure
The following applies to visualizations that require a data source. For visualizations that don’t require one, refer to Widget topic structure.
A visualization topic includes the following elements. Optional sections are marked with an asterisk:
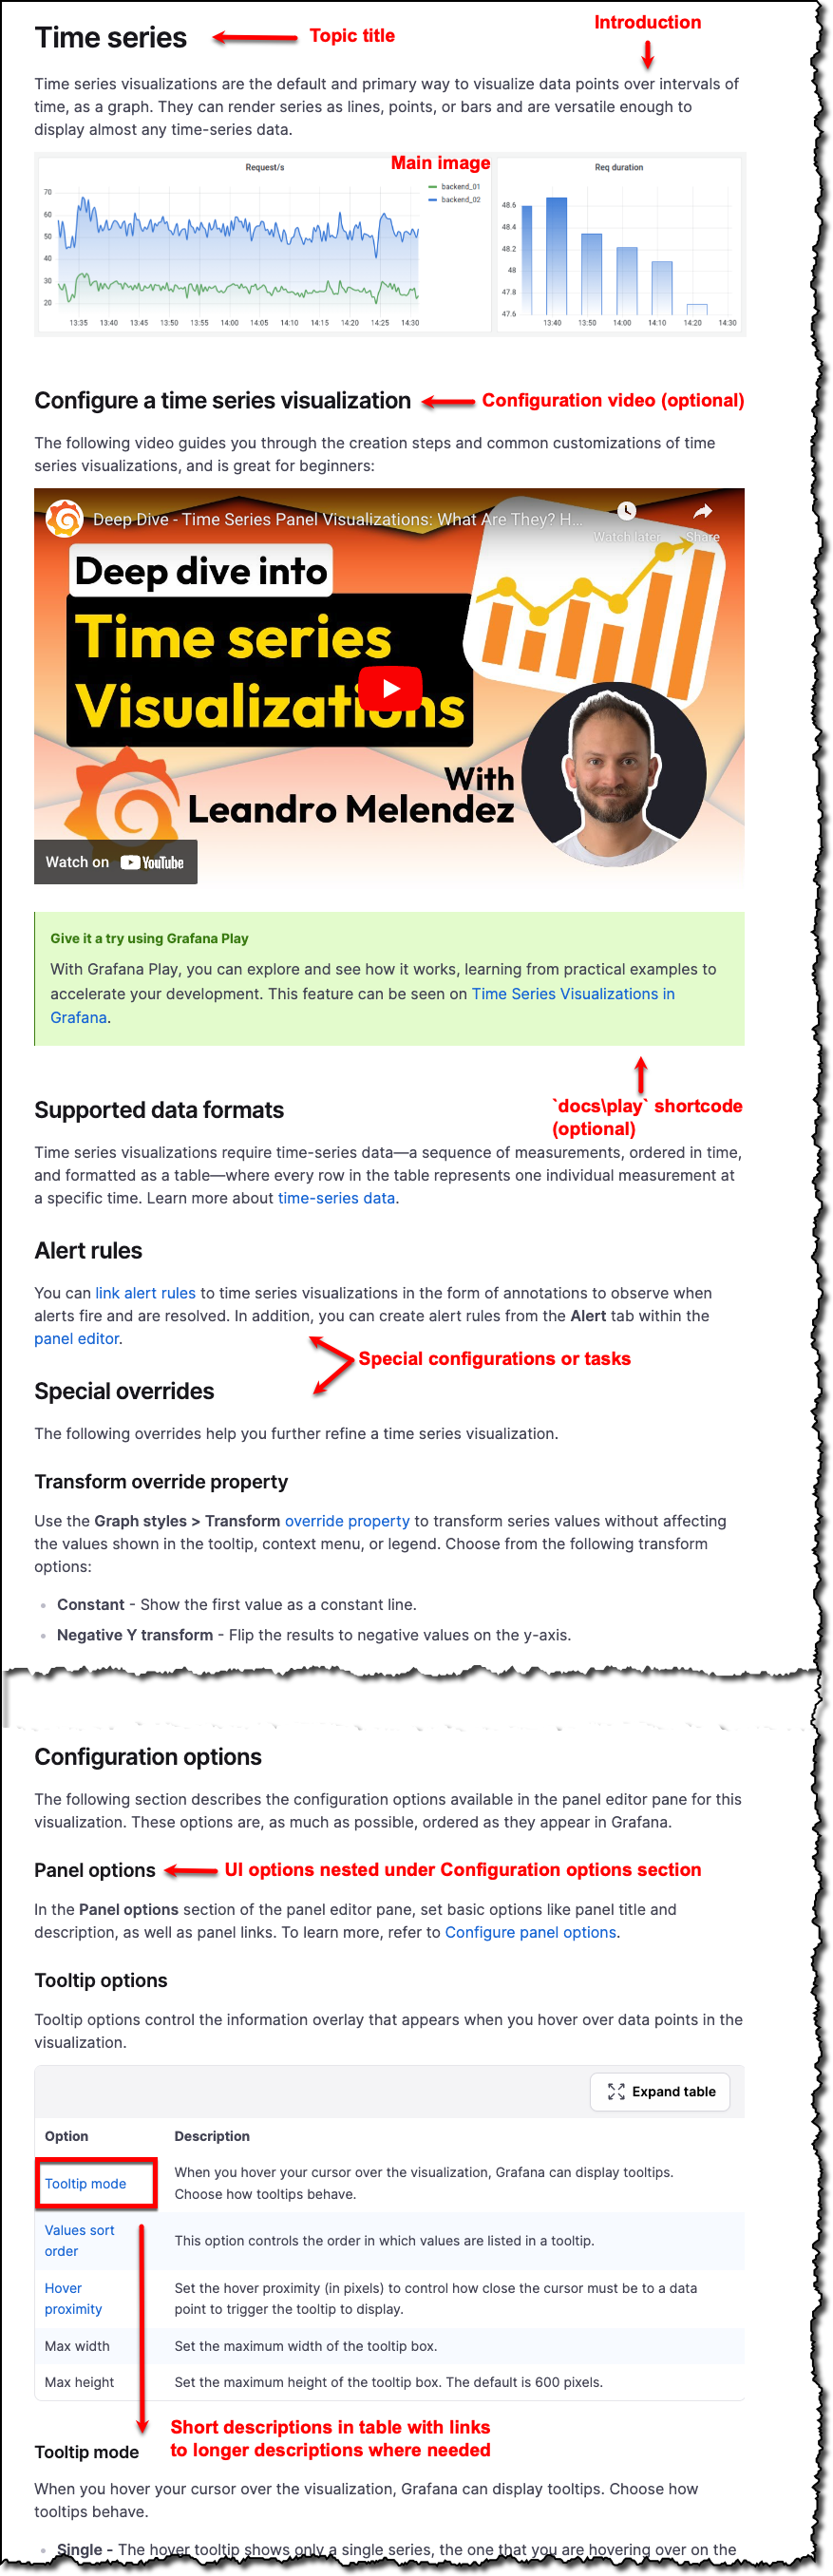
Topic title - A visualization topic title is the same as the name of the visualization as it’s written in the UI (for example, “Time series”). Don’t add the word “panel” or “visualization” to the title.
Introduction - Include an introduction that explains what the visualization type can help the user do.
Main visual - Add a clear screenshot depicting the visualization displaying a typical use case.
Body - The body can include task/how-to information as needed. The body includes the following sections:
Configure a
<VISUALIZATION>* - Link to a YouTube video describing a basic configuration example using theyoutubeshortcode.Grafana Play shortcode* - Use the
docs/playshortcode to add links to representative examples of the visualization in Grafana Play. Place this shortcode after the main image or after a configuration video.Supported data formats - Provide guidance about which data formats are supported by the visualization type. Add examples, if needed.
Special instructions or configuration options* - Add special configurations or instructions to achieve relevant tasks with the visualization. Each of these should have their own heading unless it makes sense to group some of them under a heading.
Configuration options - This is a reference section for all of the configuration options for the visualization. Use the
config-options-intro.mdshared file to add intro text to this section. Nest the options under this heading.<SECTION>options - For each expandable section of options in the panel editor pane, add a section in the topic with the name of the UI section, followed by the word “options”. For example, if a drop-down section of options is called “Axis” in the UI, include a heading in the topic called “Axis options”. List these sections in the order in which they appear in the UI.In sections with many configuration options, put them in a table and link to longer descriptions from the table. Use the provided shared files for the following options that are common to most visualization:
Data links
Field overrides
Legends
Panel options
Standard options
Thresholds
Tooltips
Value mappings
If there’s more than one shared file for an option, use the one that’s an exact match to the UI of the particular visualization. If none are a match, manually document the options or create another shared file.
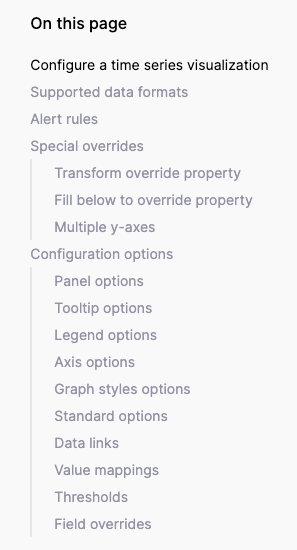
The following images show what the page-level TOC and (abridged) page might look like:
Widget topic structure
Widgets are visualizations that don’t require a data source. These visualizations have far fewer options and don’t need as much explanation. For visualizations that require a data source, refer to Visualization topic structure.
A widget topic includes the following elements:
Topic title - H1. A widget topic title is the same as the name of the widget as it’s written in the UI (for example, “Time series”). Don’t add the word “panel”, “visualization”, or “widget” to the title.
Introduction Include an introduction that explains what the visualization type can help the user do.
Main visual - Add a clear screenshot depicting the visualization displaying a typical use case.
Body - The body may include task/how-to information as needed. The body must include the following section:
<SECTION>options - For each expandable section of options in the panel edit pane, add a section in the topic with the name of the UI section, followed by the word “options”. For example, if a drop-down section of options is called “Axis” in the UI, include a section in the topic called “Axis options”.
Naming conventions
When writing about visualizations or widgets use:
- Noun form
- Lower case, unless at the beginning of a sentence
For example:
Use bar charts to graph categorical data.
A bar chart lets you graph categorical data.
There are some cases where you should use the adjective form of a visualization. You should do this if:
- The name of a visualization is already in plural form
- It’s highly confusing because of other uses of the word
- You’re referencing a visualization outside of the visualization documentation
Do this by adding the word “visualization”. For example:
Use time series visualizations to display time-series data as a graph.
A traces visualization turns traces data into a diagram.
Text visualizations allow you to directly include text or HTML in your dashboards.
Click the **Enable node graph** switch to display a node graph visualization above the trace view.
Write a visualization topic
To write a visualization or widget topic, follow these steps.
In the
grafana/grafanarepository, go to thedocs/sources/panels-visualizations/visualizationsdirectory.In the
visualizationsdirectory, create a directory with the following naming convention:- Use the name of the visualization type
- Use lowercase letters
- Add a hyphen between words
Within that directory, create an
index.mdfile.Copy the content of the Visualization template into your new index file.
For more information about the kinds of content you can add to a concept topic, refer to Visualization topic.
Add additional front matter to the
index.mdfile.For more information about front matter, refer to Front matter.
Visualization topic examples
Refer to the following topics for visualization topic examples:
Visualization template
When you’re ready to write, make a copy of the Visualization template and add your content.