Important: This documentation is about an older version. It's relevant only to the release noted, many of the features and functions have been updated or replaced. Please view the current version.
Plugin Defaults and Editor Mode
Most plugins allow users to customize the behavior by changing settings on an editor tab. These setting fields are saved in the dashboard json.
Defaults
We define fields to be saved in Grafana by creating values on the panel object of the controller. You can see these values for any panel by choosing View JSON from the settings menu in Grafana. Here is an excerpt from the clock panel json (with some fields removed), the panel data is saved in the panels array:
{
  "id": 4,
  "title": "Clock",
...
  "rows": [
    {
...
      "panels": [
        {
          "bgColor": "rgb(132, 151, 130)",
          "clockType": "24 hour",
You can define panel data by first creating a variable with default values for the fields and then setting them on the panel object:
const panelDefaults = {
  clockType: '24 hour',
  fontSize: '60px',
  fontWeight: 'normal',
  bgColor: null
};

constructor($scope, $injector) {
  super($scope, $injector);
  _.defaults(this.panel, panelDefaults);

  this.updateClock();
}
The Lodash function defaults, which is called in the code above: _.defaults, sets a default value only if the value is not already set. This way values that have been changed by the user will not be overwritten.
These panel fields can be used in the controller or module.html template:
<h2 style="font-size: {{ctrl.panel.fontSize}};">{{ctrl.time}}</h2>If you want your users to be able to change these panel values then you need to expose them in the Grafana editor.
Editor Mode
Editor mode is when a user clicks Edit on a panel. Every panel has a general tab where you change the title and width and some panels have more inbuilt tabs like the Metrics tab or Time Range tab. A panel plugin can add its own tab(s) so that a user can customize the panel.
Grafana conventions mean all you need to do is to hook up an Angular template with input fields and Grafana will automatically save the values to the dashboard json and load them on dashboard load.
Using Events
To add an editor tab you need to hook into the event model so that the tab is added when the init-edit-mode event is triggered. The following code should be added to the constructor of the plugin Ctrl class:
this.events.on('init-edit-mode', this.onInitEditMode.bind(this));Then you need to create a handler function that is bound to the event. In the example above, the handler is called onInitEditMode. The tab is added by calling the controller function, addEditorTab. This function has three parameters; the tab name, the path to a html template for the new editor tab and the tab number. It can be a bit tricky to figure out the path, the path name will be based on the id that is specified in the plugin.json file - for example grafana-clock-panel. The code below hooks up an Angular template called editor.html that is located in the src/partials directory.
onInitEditMode() {
  this.addEditorTab('Options', 'public/plugins/grafana-clock-panel/editor.html', 2);
}
Editor HTML and CSS
For editor tabs html, it is best to use Grafana css styles rather than custom styles. This is to preserve the look and feel of other tabs in Grafana.
Most editor tabs should use the gf-form css class from Grafana. The example below has one row with a couple of columns and each column is wrapped in a div like this:
<div class="section gf-form-group">Then each pair, label and field is wrapped in a div with a gf-form class.
<div class="gf-form">
  <label class="gf-form-label width-8">Font Size</label>
  <input type="text" class="gf-form-input width-4" ng-model="ctrl.panel.fontSize" ng-change="ctrl.render()" ng-model-onblur>
</div>
Note that there are some Angular attributes here. ng-model will update the panel data. ng-change will render the panel when you change the value. This change will occur on the onblur event due to the ng-model-onblur attribute. This means you can see the effect of your changes on the panel while editing.

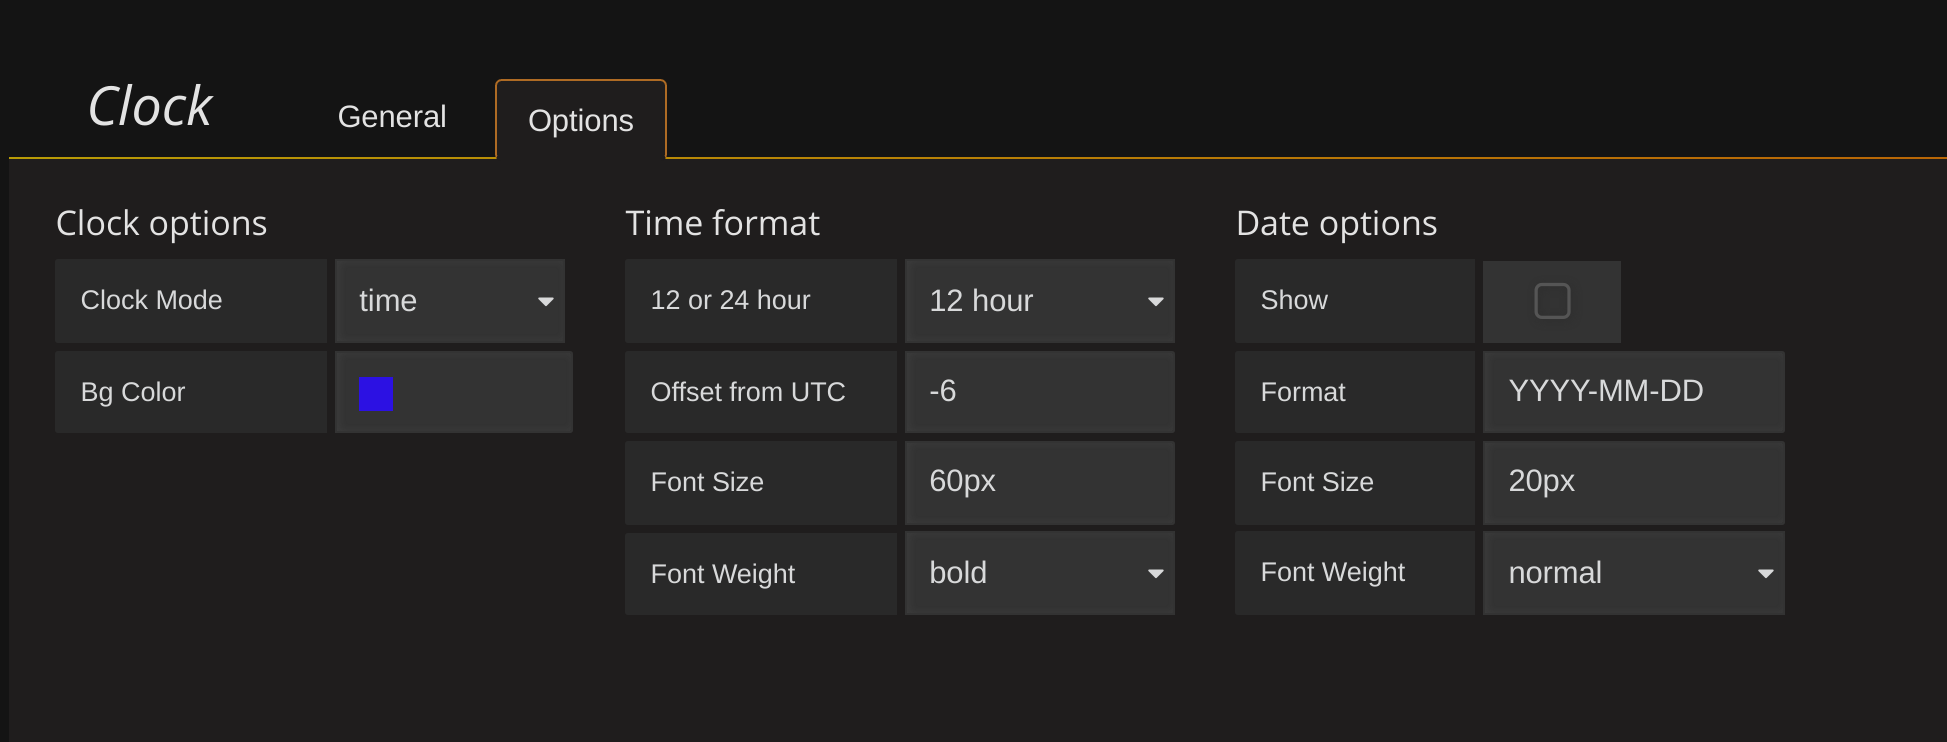
On the editor tab we use a drop down for 12/24 hour clock, an input field for font size and a color picker for the background color.
The drop down/select has its own gf-form-select-wrapper css class and looks like this:
<div class="gf-form">
  <label class="gf-form-label width-9">12 or 24 hour</label>
  <div class="gf-form-select-wrapper max-width-9">
    <select class="input-small gf-form-input" ng-model="ctrl.panel.clockType" ng-options="t for t in ['12 hour', '24 hour', 'custom']" ng-change="ctrl.render()"></select>
  </div>
</div>
The color picker (or spectrum picker) is a component that already exists in Grafana. We use it like this for the background color:
<spectrum-picker class="gf-form-input" ng-model="ctrl.panel.bgColor" ng-change="ctrl.render()" ></spectrum-picker>Editor Tab Finished
To reiterate, this all ties together quite neatly. We specify properties and panel defaults in the constructor for the panel controller and these can then be changed in the editor. Grafana takes care of saving the changes.
One thing to be aware of is that panel defaults are used the first time a panel is created to set the initial values of the panel properties. After the panel is saved then the saved value will be used instead. So beware if you update panel defaults they will not automatically update the property in an existing panel. For example, if you set the default font size to 60px first and then in version 2 of the plugin change it to 50px, existing panels will still have 60px and only new panels will get the new 50px value.
Was this page helpful?
Related resources from Grafana Labs


