Important: This documentation is about an older version. It's relevant only to the release noted, many of the features and functions have been updated or replaced. Please view the current version.
Using Prometheus in Grafana
Grafana includes support for Prometheus Datasources. While the process of adding the datasource is similar to adding a Graphite or OpenTSDB datasource type, Prometheus does have a few different options for building queries.
Adding the data source to Grafana
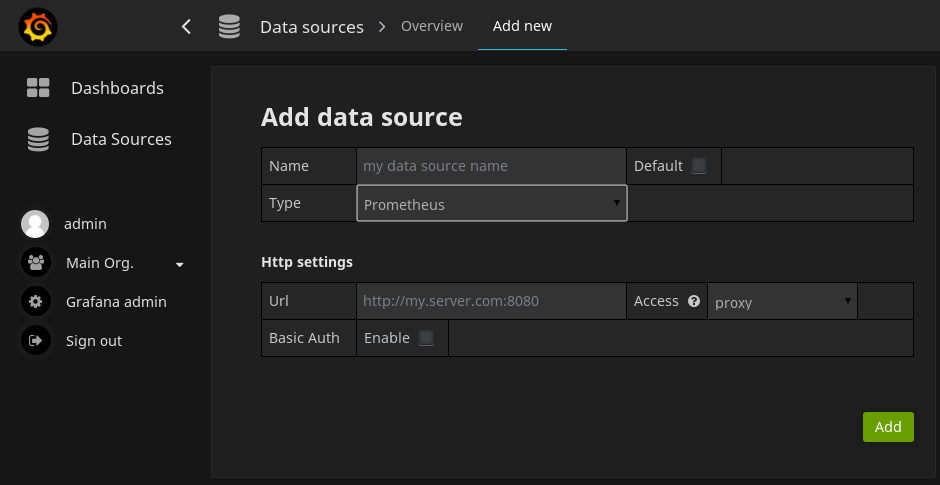
Open the side menu by clicking the the Grafana icon in the top header.
In the side menu under the
Dashboardslink you should find a link namedData Sources.NOTE: If this link is missing in the side menu it means that your current user does not have the
Adminrole for the current organization.Click the
Add newlink in the top header.Select
Prometheusfrom the dropdown.
| Name | Description |
|---|---|
| Name | The data source name, important that this is the same as in Grafana v1.x if you plan to import old dashboards. |
| Default | Default data source means that it will be pre-selected for new panels. |
| Url | The http protocol, ip and port of you Prometheus server (default port is usually 9090) |
| Access | Proxy = access via Grafana backend, Direct = access directly from browser. |
| Basic Auth | Enable basic authentication to the Prometheus datasource. |
| User | Name of your Prometheus user |
| Password | Database user’s password |
Proxy access means that the Grafana backend will proxy all requests from the browser, and send them on to the Data Source. This is useful because it can eliminate CORS (Cross Origin Site Resource) issues, as well as eliminate the need to disseminate authentication details to the Data Source to the browser.
Direct access is still supported because in some cases it may be useful to access a Data Source directly depending on the use case and topology of Grafana, the user, and the Data Source.
Query editor
Open a graph in edit mode by click the title.

For details on Prometheus metric queries check out the Prometheus documentation
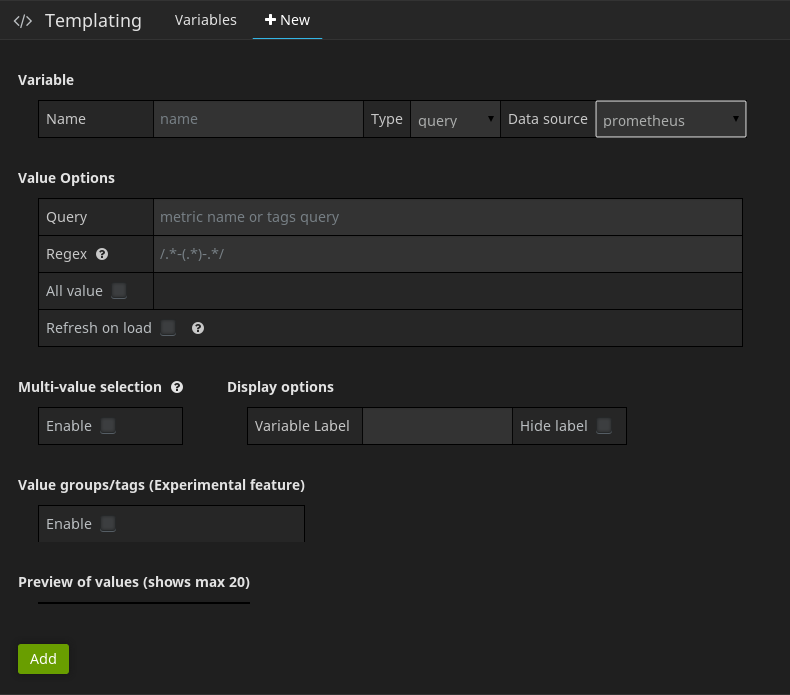
Templated queries
Prometheus Datasource Plugin provides the following functions in Variables values query field in Templating Editor to query metric names and labels names on the Prometheus server.
| Name | Description |
|---|---|
label_values(label) | Returns a list of label values for the label in every metric. |
label_values(metric, label) | Returns a list of label values for the label in the specified metric. |
metrics(metric) | Returns a list of metrics matching the specified metric regex. |
query_result(query) | Returns a list of Prometheus query result for the query. |
For details of metric names & label names, and label values, please refer to the Prometheus documentation.
Note: The part of queries is incompatible with the version before 2.6, if you specify like
foo.*, please change likemetrics(foo.*).
You can create a template variable in Grafana and have that variable filled with values from any Prometheus metric exploration query. You can then use this variable in your Prometheus metric queries.
For example you can have a variable that contains all values for label hostname if you specify a query like this in the templating edit view.
label_values(hostname)You can also use raw queries & regular expressions to extract anything you might need.
Using templated variables in queries
When the Include All option or Multi-Value option is enabled, Grafana converts the labels from plain text to a regex compatible string.
Which means you have to use =~ instead of = in your Prometheus queries. For example ALERTS{instance=~$instance} instead of ALERTS{instance=$instance}.
Was this page helpful?
Related resources from Grafana Labs