
Important: This documentation is about an older version. It's relevant only to the release noted, many of the features and functions have been updated or replaced. Please view the current version.
Using OpenTSDB in Grafana
The newest release of Grafana adds additional functionality when using an OpenTSDB Data source.
Open the side menu by clicking the the Grafana icon in the top header.
In the side menu under the
Dashboardslink you should find a link namedData Sources.NOTE: If this link is missing in the side menu it means that your current user does not have the
Adminrole for the current organization.Click the
Add newlink in the top header.Select
OpenTSDBfrom the dropdown.
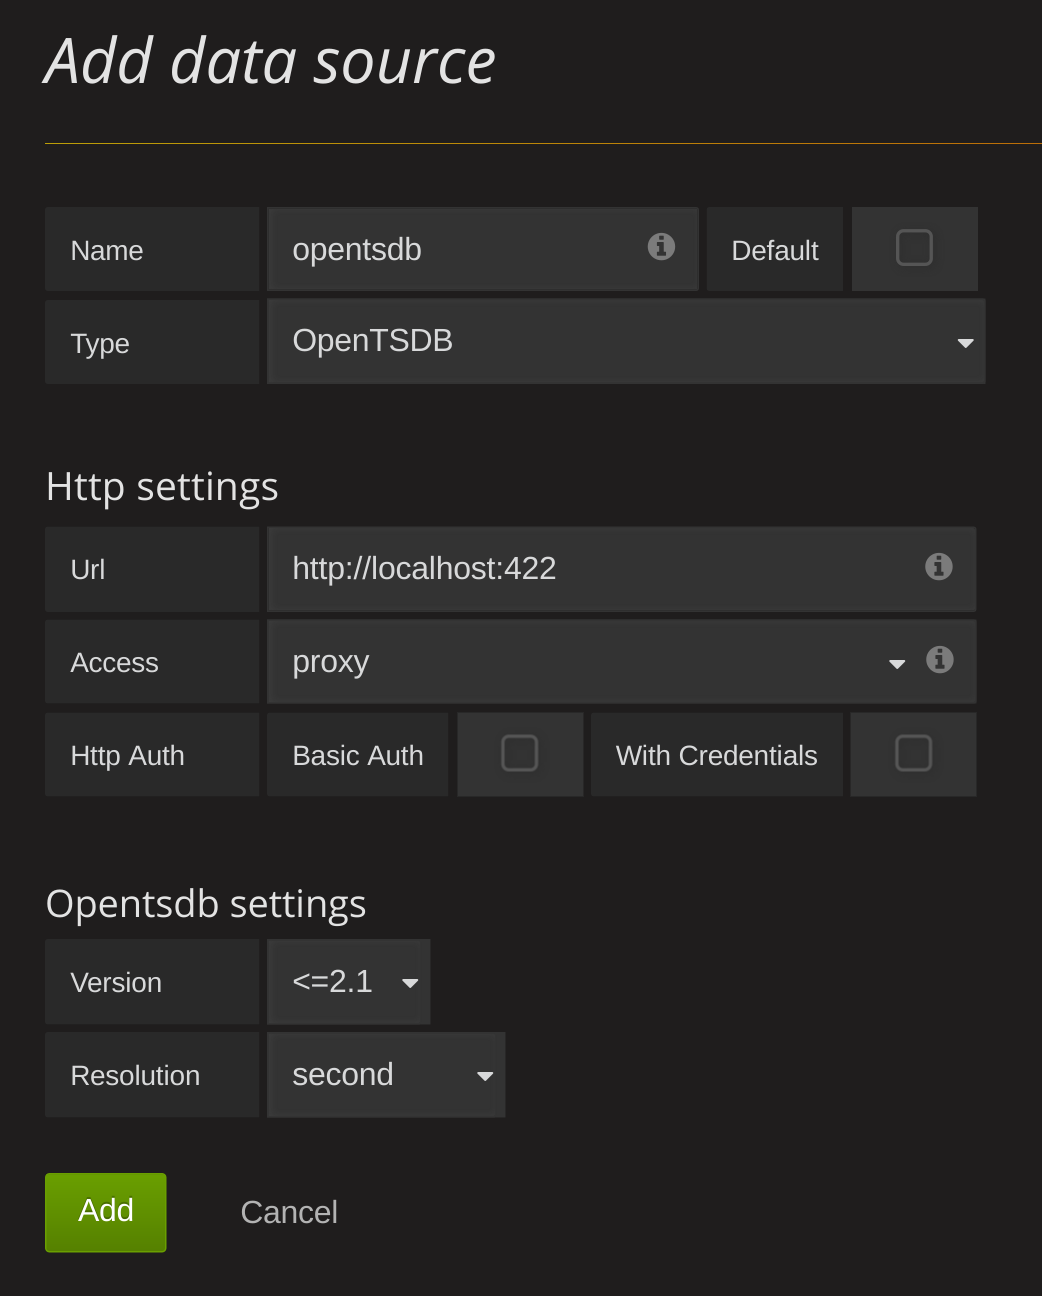
| Name | Description |
|---|---|
| Name | The data source name, important that this is the same as in Grafana v1.x if you plan to import old dashboards. |
| Default | Default data source means that it will be pre-selected for new panels. |
| Url | The http protocol, ip and port of you opentsdb server (default port is usually 4242) |
| Access | Proxy = access via Grafana backend, Direct = access directly from browser. |
| Version | Version = opentsdb version, either <=2.1 or 2.2 |
| Resolution | Metrics from opentsdb may have datapoints with either second or millisecond resolution. |
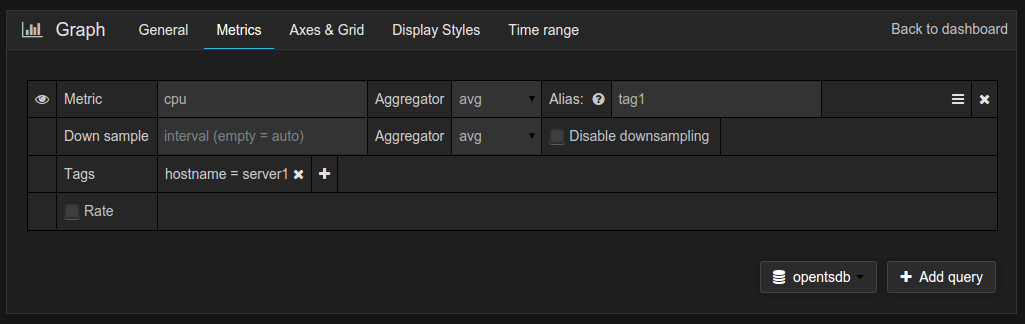
Query editor
Open a graph in edit mode by click the title. Query editor will differ if the datasource has version <=2.1 or = 2.2. In the former version, only tags can be used to query opentsdb. But in the latter version, filters as well as tags can be used to query opentsdb. Fill Policy is also introduced in opentsdb 2.2.
Note: While using Opentsdb 2.2 datasource, make sure you use either Filters or Tags as they are mutually exclusive. If used together, might give you weird results.
Auto complete suggestions
As soon as you start typing metric names, tag names and tag values , you should see highlighted auto complete suggestions for them.
Note: This is required for the OpenTSDB
suggestapi to work.
Templating queries
Grafana’s OpenTSDB data source now supports template variable values queries. This means you can create template variables that fetch the values from OpenTSDB (for example metric names, tag names, or tag values). The query editor is also enhanced to limiting tags by metric.
When using OpenTSDB with a template variable of query type you can use following syntax for lookup.
metrics(prefix)               // returns metric names with specific prefix (can be empty)
tag_names(cpu)                // return tag names (i.e. keys) for a specific cpu metric
tag_values(cpu, hostname)     // return tag values for metric cpu and tag key hostname
suggest_tagk(prefix)          // return tag names (i.e. keys) for all metrics with specific prefix (can be empty)
suggest_tagv(prefix)          // return tag values for all metrics with specific prefix (can be empty)
If you do not see template variables being populated in Preview of values section, you need to enable tsd.core.meta.enable_realtime_ts in the OpenTSDB server settings. Also, to populate metadata of the existing time series data in OpenTSDB, you need to run tsdb uid metasync on the OpenTSDB server.
Nested Templating
One template variable can be used to filter tag values for another template varible. Very importantly, the order of the parameters matter in tag_values function. First parameter is the metric name, second parameter is the tag key for which you need to find tag values, and after that all other dependent template variables. Some examples are mentioned below to make nested template queries work successfully.
tag_values(cpu, hostname, env=$env)                   // return tag values for cpu metric, selected env tag value and tag key hostname
tag_values(cpu, hostanme, env=$env, region=$region)   // return tag values for cpu metric, selected env tag value, selected region tag value and tag key hostname
Note: This is required for the OpenTSDB
lookupapi to work.
For details on opentsdb metric queries checkout the official OpenTSDB documentation
Was this page helpful?
Related resources from Grafana Labs


