
Important: This documentation is about an older version. It's relevant only to the release noted, many of the features and functions have been updated or replaced. Please view the current version.
Annotations
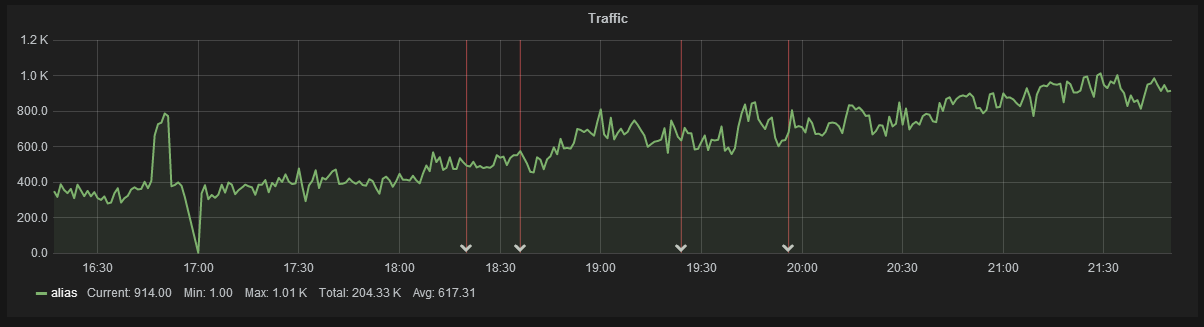
Annotations provide a way to mark points on the graph with rich events. When you hover over an annotation you can get title, tags, and text information for the event.
To add an annotation query click dashboard settings icon in top menu and select Annotations from the
dropdown. This will open the Annotations edit view. Click the Add tab to add a new annotation query.
Note: Annotations apply to all graphs in a given dashboard, not on a per-panel basis.
Graphite annotations
Graphite supports two ways to query annotations.
- A regular metric query, use the
Graphite target expressiontext input for this - Graphite events query, use the
Graphite event tagstext input, specify an tag or wildcard (leave empty should also work)
Elasticsearch annotations
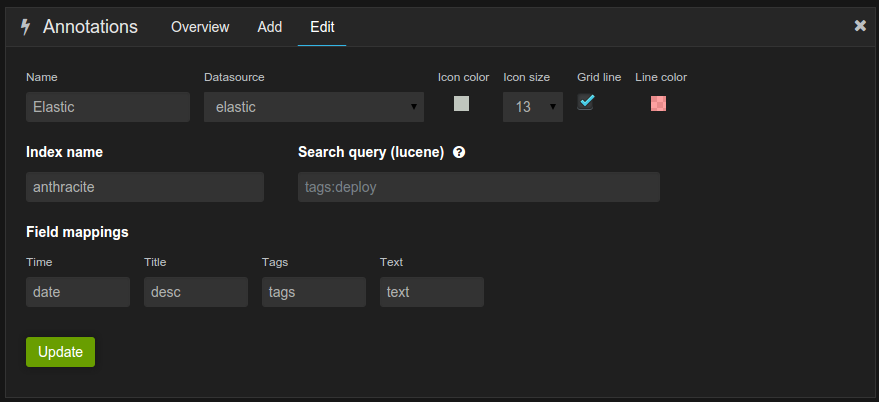
Grafana can query any Elasticsearch index for annotation events. The index name can be the name of an alias or an index wildcard pattern. You can leave the search query blank or specify a lucene query.
If your elasticsearch document has a timestamp field other than @timestamp you will need to specify that. As well
as the name for the fields that should be used for the annotation title, tags and text. Tags and text are optional.
Note The annotation timestamp field in elasticsearch need to be in UTC format.
InfluxDB Annotations
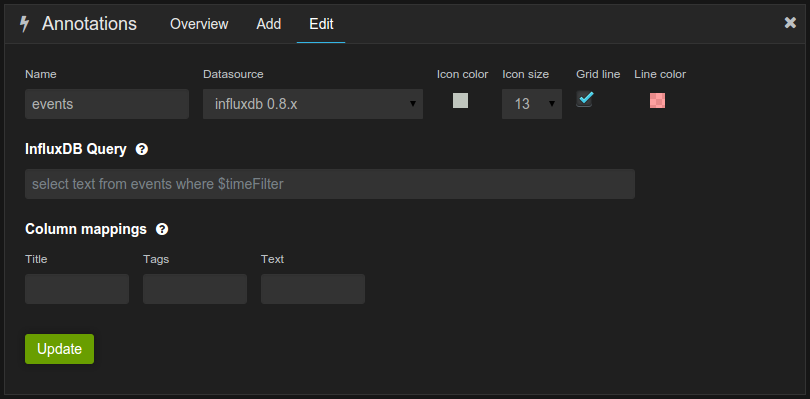
For InfluxDB you need to enter a query like in the above screenshot. You need to have the where $timeFilter part.
If you only select one column you will not need to enter anything in the column mapping fields.
Prometheus Annotations
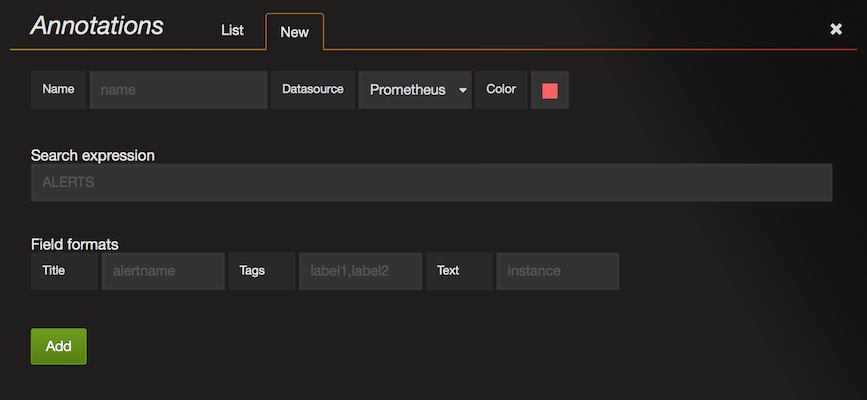
Prometheus supports two ways to query annotations.
- A regular metric query
- A Prometheus query for pending and firing alerts (for details see Inspecting alerts during runtime)
Was this page helpful?
Related resources from Grafana Labs


