TraceQL metrics
TraceQL metrics is a feature in Grafana Tempo that creates metrics from traces.
Metric queries extend trace queries by applying a function to trace query results. This powerful feature allows for ad hoc aggregation of any existing TraceQL query by any dimension available in your traces, much in the same way that LogQL metric queries create metrics from logs.
Traces are a unique observability signal that contain causal relationships between the components in your system.
TraceQL metrics can help answer questions like this:
- How many database calls across all systems are downstream of your application?
- What services beneath a given endpoint are failing?
- What services beneath an endpoint are slow?
TraceQL metrics can help you answer these questions by parsing your traces in aggregate.
TraceQL metrics are powered by the TraceQL metrics API.
RED metrics, TraceQL, and PromQL
RED is an acronym for three types of metrics:
- Rate, the number of requests per second
- Errors, the number of those requests that are failing
- Duration, the amount of time those requests take
For more information about the RED method, refer to The RED Method: how to instrument your services.
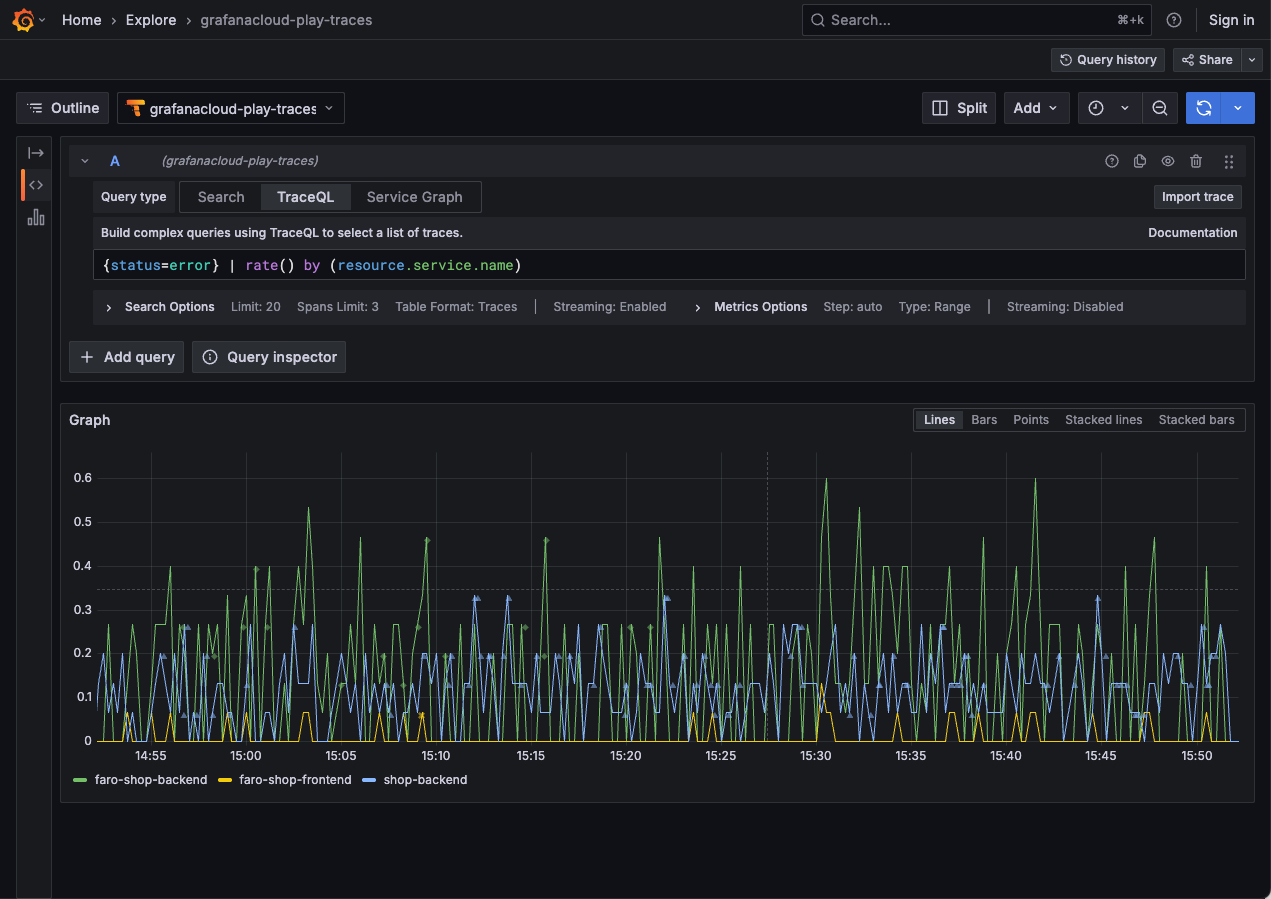
You can write TraceQL metrics queries to compute rate, errors, and durations over different groups of spans.
For more information on how to use TraceQL metrics to investigate issues, refer to Solve problems with metrics queries.
Enable and use TraceQL metrics
To use TraceQL metrics, you need to enable them on your Tempo database. Refer to Configure TraceQL metrics for more information.
From there, you can either query the TraceQL metrics API directly (for example, with curl) or using Grafana
(recommended).
To run TraceQL metrics queries in Grafana, you need Grafana Cloud or Grafana 10.4 or later.
No extra configuration is needed.
Use a Tempo data source that points to a Tempo database with TraceQL metrics enabled.
Refer to Solve problems using metrics queries for some real-world examples.
Functions
TraceQL metrics queries currently include the following functions for aggregating over groups of spans: rate,
count_over_time, sum_over_time, max_over_time, min_over_time, avg_over_time, quantile_over_time,
histogram_over_time, and compare.
These functions can be added as an operator at the end of any TraceQL query.
The topk and bottomk functions and comparison operators (>, >=, <, <=, =, !=) are supported on TraceQL metrics results.
For detailed information and example queries for each function, refer to TraceQL metrics functions.
Exemplars
Exemplars are a powerful feature of TraceQL metrics. They allow you to see an exact trace that contributed to a given metric value. This is particularly useful when you want to understand why a given metric is high or low.
Exemplars are available in TraceQL metrics for all range queries.
To get exemplars, you need to configure it in the query-frontend with the parameter
query_frontend.metrics.max_exemplars,
or pass a query hint in your query.
Example:
{ span:name = "GET /:endpoint" } | quantile_over_time(duration, .99) by (span.http.target) with (exemplars=true)Faster read path (experimental)
Note
Tempo is an experimental feature. Engineering and on-call support is not available. Documentation is either limited or not provided outside of code comments. No SLA is provided. Enable the feature toggle in Grafana to use this feature. Do not enable this feature in production environments.
In vParquet5, you can use an experimental span-only fetch layer to significantly improve performance for most metrics queries. This optimized read path processes individual spans instead of full traces, reducing latency and memory usage.
You must enable the faster read path explicitly using a query hint or a per-tenant override. Once enabled, it applies to metrics queries that don’t require knowledge of the full trace structure. Queries using structural operators like >>, <<, ~, !>>, !<<, or !~ still use the standard fetch layer.
Enable with a query hint
Add the spanonly_fetch=true hint to your query. This hint requires
unsafe_query_hints to be enabled for the tenant.
{ resource.service.name = "frontend" } | rate() by (status) with (spanonly_fetch=true)Enable with a per-tenant override
Operators can enable the faster read path by default for a tenant using the metrics_spanonly_fetch override. When set, it applies to all eligible metrics queries for that tenant without requiring a query hint. This override doesn’t require unsafe_query_hints.
overrides:
  'tenant-id':
    read:
      metrics_spanonly_fetch: true
When unsafe_query_hints is also enabled for the tenant, the spanonly_fetch query hint takes precedence over the per-tenant override. Users can set spanonly_fetch=false to opt out, or spanonly_fetch=true to opt in even when the override is disabled.