Important: This documentation is about an older version. It's relevant only to the release noted, many of the features and functions have been updated or replaced. Please view the current version.
TraceQL metrics
Note
TraceQL metrics is an experimental feature. Engineering and on-call support is not available. Documentation is either limited or not provided outside of code comments. No SLA is provided. Enable the feature toggle in Grafana to use this feature. Do not enable this feature in production environments.
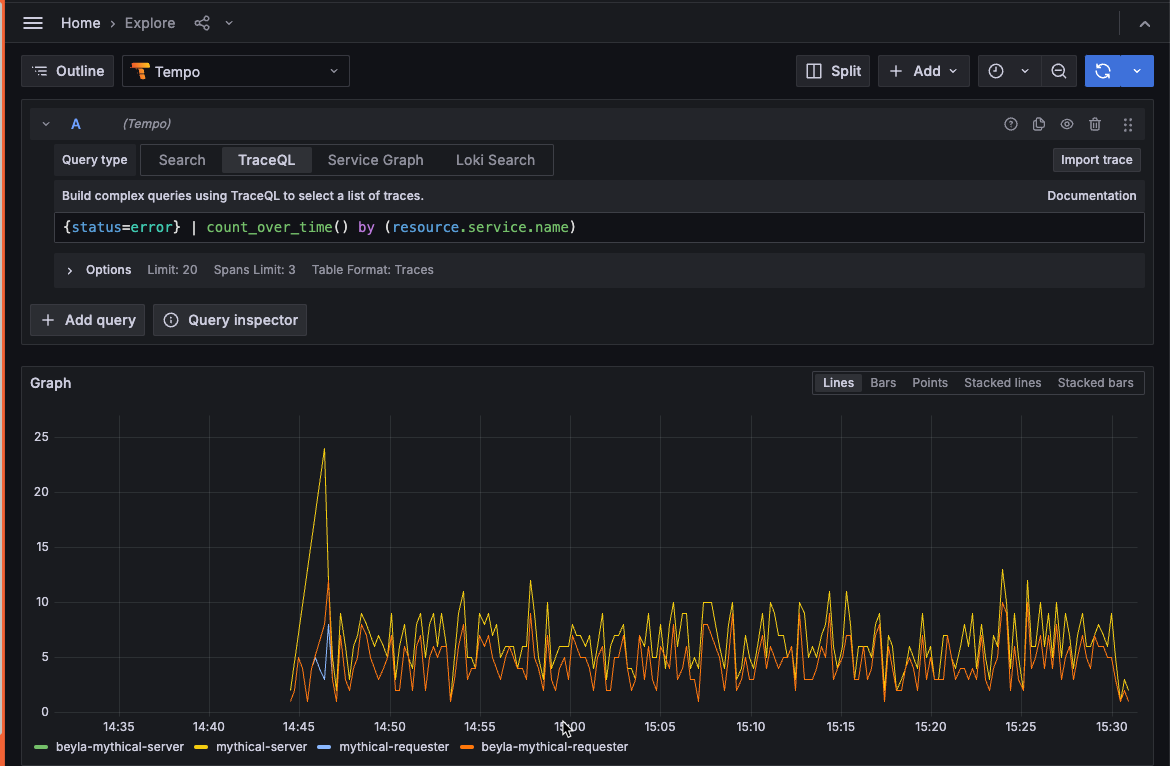
Tempo 2.4 introduces the addition of metrics queries to the TraceQL language as an experimental feature.
Metric queries extend trace queries by applying a function to trace query results.
This powerful feature creates metrics from traces, much in the same way that LogQL metric queries create metrics from logs.
Initially, only count_over_time and rate are supported.
For example:
{ resource.service.name = "foo" && status = error } | rate()In this case, we are calculating the rate of the erroring spans coming from the service foo. Rate is a spans/sec quantity.
Combined with the by() operator, this can be even more powerful!
{ resource.service.name = "foo" && status = error } | rate() by (span.http.route)Now, we are still rating the erroring spans in the service foo but the metrics have been broken
down by HTTP endpoint. This might let you determine that /api/sad had a higher rate of erroring
spans than /api/happy, for example.
Enable and use TraceQL metrics
You can use the TraceQL metrics in Grafana with any existing or new Tempo data source. This capability is available in Grafana Cloud and Grafana (10.4 and newer).

Before you begin
To use the metrics generated from traces, you need to:
- Set the
local-blocksprocessor to active in yourmetrics-generatorconfiguration - Configure a Tempo data source configured in Grafana or Grafana Cloud
- Access Grafana Cloud or Grafana 10.4
Configure the local-blocks processor
Once the local-blocks processor is enabled in your metrics-generator
configuration, you can configure it using the following block to make sure
it records all spans for TraceQL metrics.
Here is an example configuration:
 metrics_generator:
  processor:
    local_blocks:
      filter_server_spans: false
  storage:
    path: /tmp/tempo/generator/wal
  traces_storage:
    path: /tmp/tempo/generator/traces
Refer to the metrics-generator configuration documentation for more information.
Evaluate query timeouts
Because of their expensive nature, these queries can take a long time to run in different systems. As such, consider increasing the timeouts in various places of the system to allow enough time for the data to be returned.
Consider these areas when raising timeouts:
- Any proxy in front of Grafana
- Grafana data source for Prometheus pointing at Tempo
- Tempo configuration
querier.search.query_timeoutserver.http_server_read_timeoutserver.http_server_write_timeout
Additionally, a new query_frontend.metrics config has been added. The config
here will depend on the environment.
For example, in a cloud environment, smaller jobs with more concurrency may be desired due to the nature of scale on the backend.
query_frontend:
    metrics:
        concurrent_jobs: 1000
        target_bytes_per_job: 2.25e+08 # ~225MB
        interval: 30m0s
For an on-prem backend, you can improve query times by lowering the concurrency, while increasing the job size.
query_frontend:
    metrics:
        concurrent_jobs: 8
        target_bytes_per_job: 1.25e+09 # ~1.25GB
