Important: This documentation is about an older version. It's relevant only to the release noted, many of the features and functions have been updated or replaced. Please view the current version.
Automatic logging: Trace discovery through logs
Running distributed tracing systems is very powerful, but it brings its own challenges, and one of them is trace discovery. Tempo supports finding a trace if you know the trace identifier, so we leverage other tools like logs and metrics to discover traces.
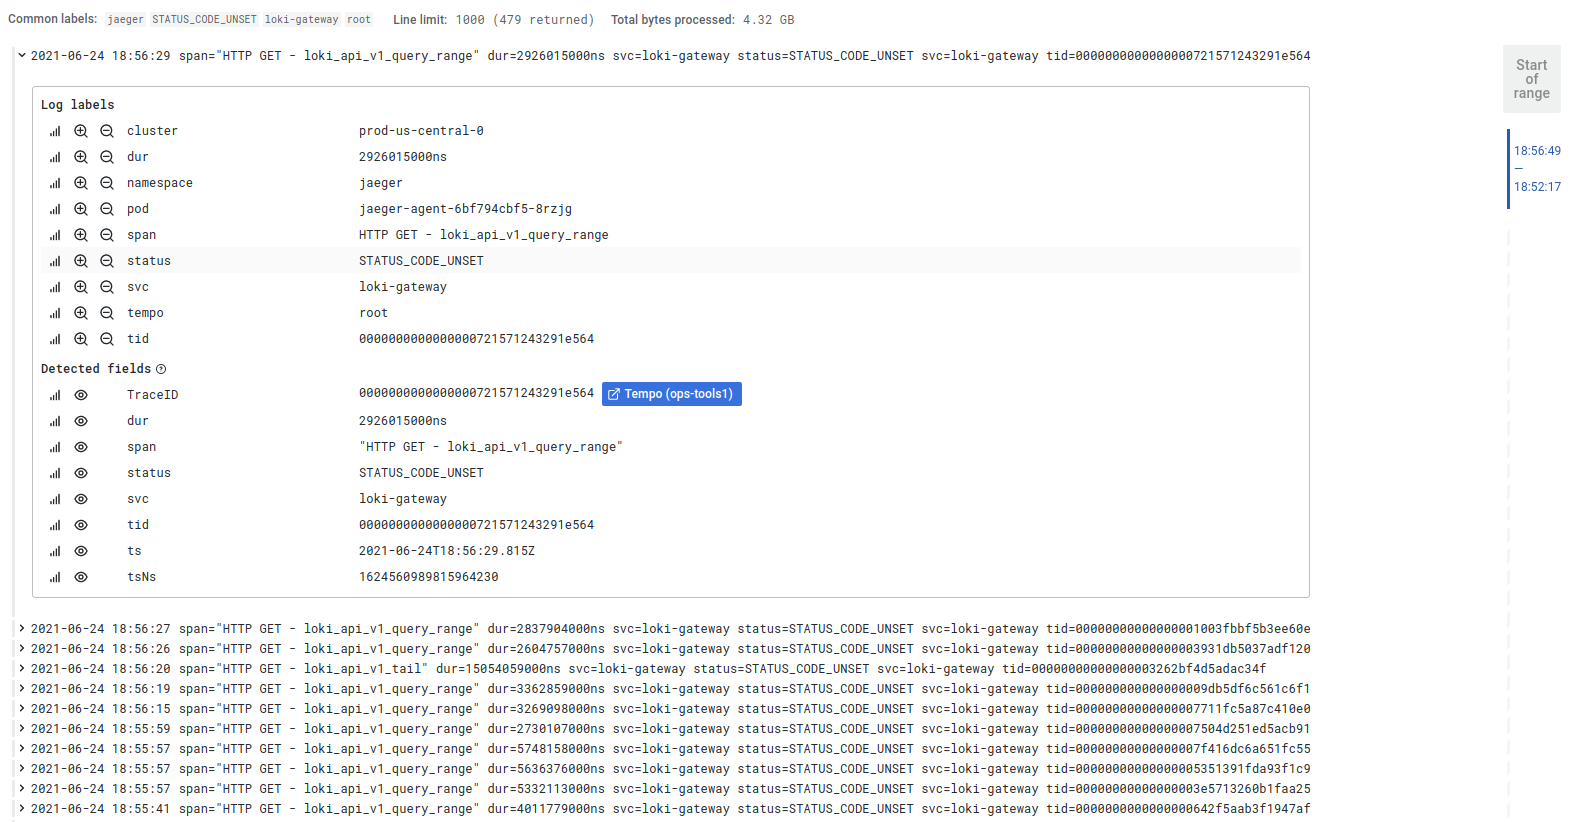
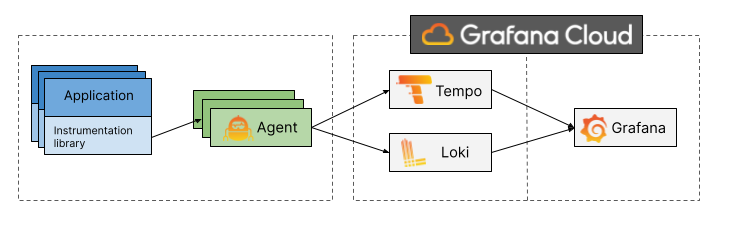
Automatic logging provides an easy and fast way of getting trace discovery through logs. Automatic logging writes a well formatted log line to a Loki instance or to stdout for each span, root or process that passes through the tracing pipeline. This allows for automatically building a mechanism for trace discovery. On top of that, we also get metrics from traces using Loki.
For high throughput systems, logging for every span may generate too much volume. In such cases, logging per root span or process is recommended.
Automatic logging searches for a given set of attributes in the spans and logs them as key-value pairs. This allows searching by those key-value pairs in Loki.
Quickstart
To configure it, you need to select your preferred backend and what trace data to log. To see all the available config options, refer to the configuration reference.
This simple example logs trace roots to stdout and is a good way to get started using automatic logging:
traces:
  configs:
  - name: default
    ...
    automatic_logging:
      backend: stdout
      roots: true
If you would like to push logs directly to a Loki instance also configured in the same Grafana Agent you would do something like this:
traces:
  configs:
  - name: default
    ...
    automatic_logging:
      backend: logs_instance
      logs_instance_name: default
      roots: true
Example