Important: This documentation is about an older version. It's relevant only to the release noted, many of the features and functions have been updated or replaced. Please view the current version.
What are traces?
A trace represents the whole journey of a request or an action as it moves through all the nodes of a distributed system, especially containerized applications or microservices architectures. Traces let you profile and observe systems, making it easy to discover bottlenecks and interconnection issues.
Traces are composed of one or more spans. A span is a unit of work within a trace that has a start time relative to the beginning of the trace, a duration and an operation name for the unit of work. It usually has a reference to a parent span (unless it is the first span in a trace). It may optionally include key/value attributes that are relevant to the span itself, for example the HTTP method being used by the span, as well as other metadata such as sub-span events or links to other spans.
Example of traces
Firstly, a user on your website enters their email address into a form to sign up for your mailing list. They click Enter. This initial transaction has a trace ID that is subsequently associated with every interaction in the chain of processes within a system.
Next, the user’s email address is data that flows through your system. In a cloud computing world, it is possible that clicking that one button causes data to touch multiple nodes across your cluster of microservices.
As a result, the email address might be sent to a verification algorithm sitting in a microservice that exists solely for that purpose. If it passes the check, the information is stored in a database.
Along the way, an anonymization node strips personally identifying data from the address and sends metadata collected to a marketing qualifying algorithm to determine whether the request was sent from a targeted part of the internet.
Services respond and data flows back from each, sometimes triggering new events across the system. Along the way, logs are written in various nodes with a time stamp showing when the info passed through.
Finally, the request and response activity ends and a record of that request is sent to Grafana or Grafana Cloud.
Traces and trace IDs
Setting up tracing adds an identifier, or trace ID, to all of these events. The trace ID is generated when the request is initiated and that same trace ID is applied to every single event as the request and response generate activity across the system.
That trace ID enables one to trace, or follow a request as it flows from node to node, service to microservice to lambda function to wherever it goes in your chaotic, cloud computing system and back again. This is recorded and displayed as spans.
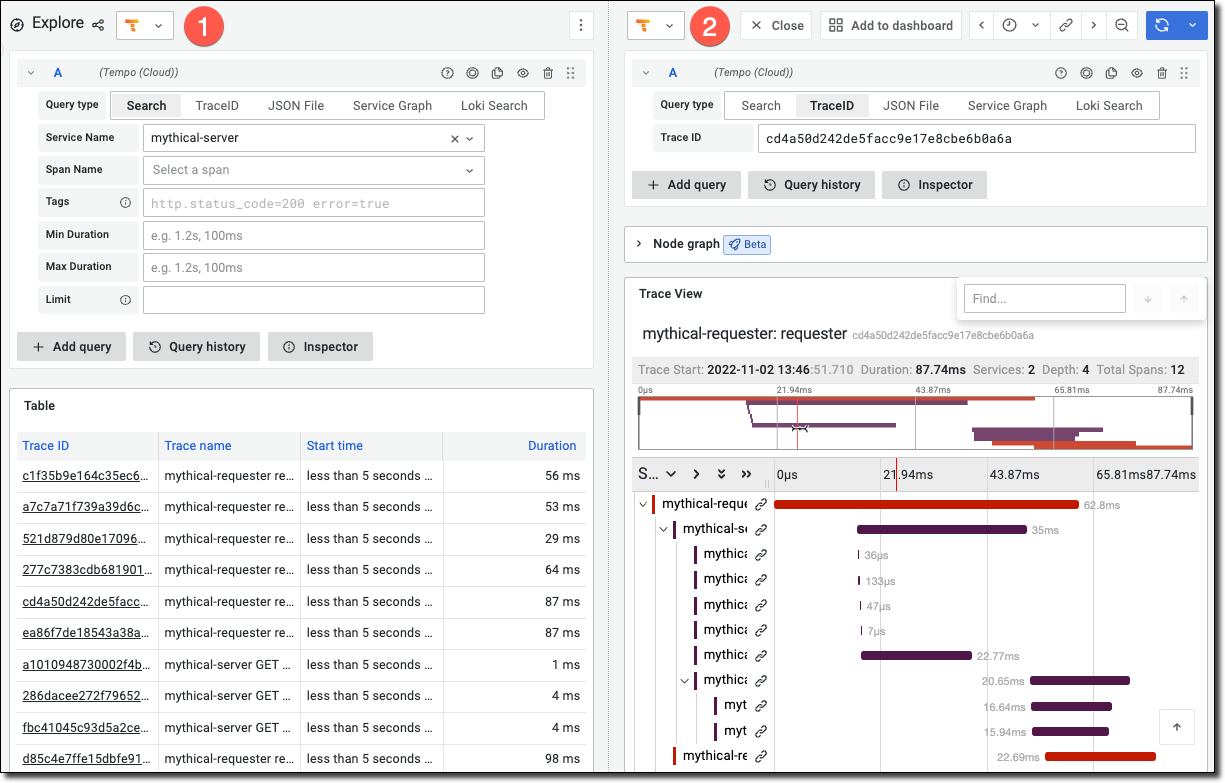
Here’s an example showing two pages in Grafana Cloud. The first, on the left (1), shows a query using the Explore feature. In the query results you can see a traceID field that was added to an application. That field contains a Tempo trace ID. The second page, on the right (2), uses the same Explore feature to perform a Tempo search using that trace ID. It then shows a set of spans as horizontal bars, each bar denoting a different part of the system.
The trace ID is applied to activities recorded as metrics and as logs.
What are traces used for?
Traces can help you find bottlenecks. A trace can be visualized to give a graphic representation of how long it takes for each step in the data flow pathway to complete. It can show where new requests are initiated and end, and how your system responds. This data helps you locate problem areas, often in places you never would have anticipated or found without this ability to trace the request flow.
Metrics, logs, and traces form the three pillars of observability. Metrics provide the health data about the state of a system. Logs provide an audit trail of activity that create an informational context. Traces tell you what happens at each step or action in a data pathway.
Terminology
- Data source
- A basic storage for data such as a database, a flat file, or even live references or measurements from a device. dA file, database, or service that provides data. For example, traces data is imported into Grafana by configuring and enabling a Tempo data source.
- Exemplar
- Any data that serves as a detailed example of one of the observations aggregated into a metric. An exemplar contains the observed value together with an optional timestamp and arbitrary trace IDs, which are typically used to reference a trace.
- Log
- Chronological events, usually text-based, allowing for the diagnosis of problems. Logs can provide informational context, such as detailed records of all events during user interactions, for example, when events happen, who used the system, status messages, etc.
- Metric
- A number that helps an operator understand the state of a system, such as the number of active users, error count, average response time, and more.
- Span
- A unit of work done within a trace.
- Trace
- An observed execution path of a request through a distributed system.

