Important: This documentation is about an older version. It's relevant only to the release noted, many of the features and functions have been updated or replaced. Please view the current version.
Tempo in Grafana
Grafana has a built-in Tempo datasource that can be used to query Tempo and visualize traces. This page describes the high-level features and their availability. Use the latest versions for best compatibility and stability.
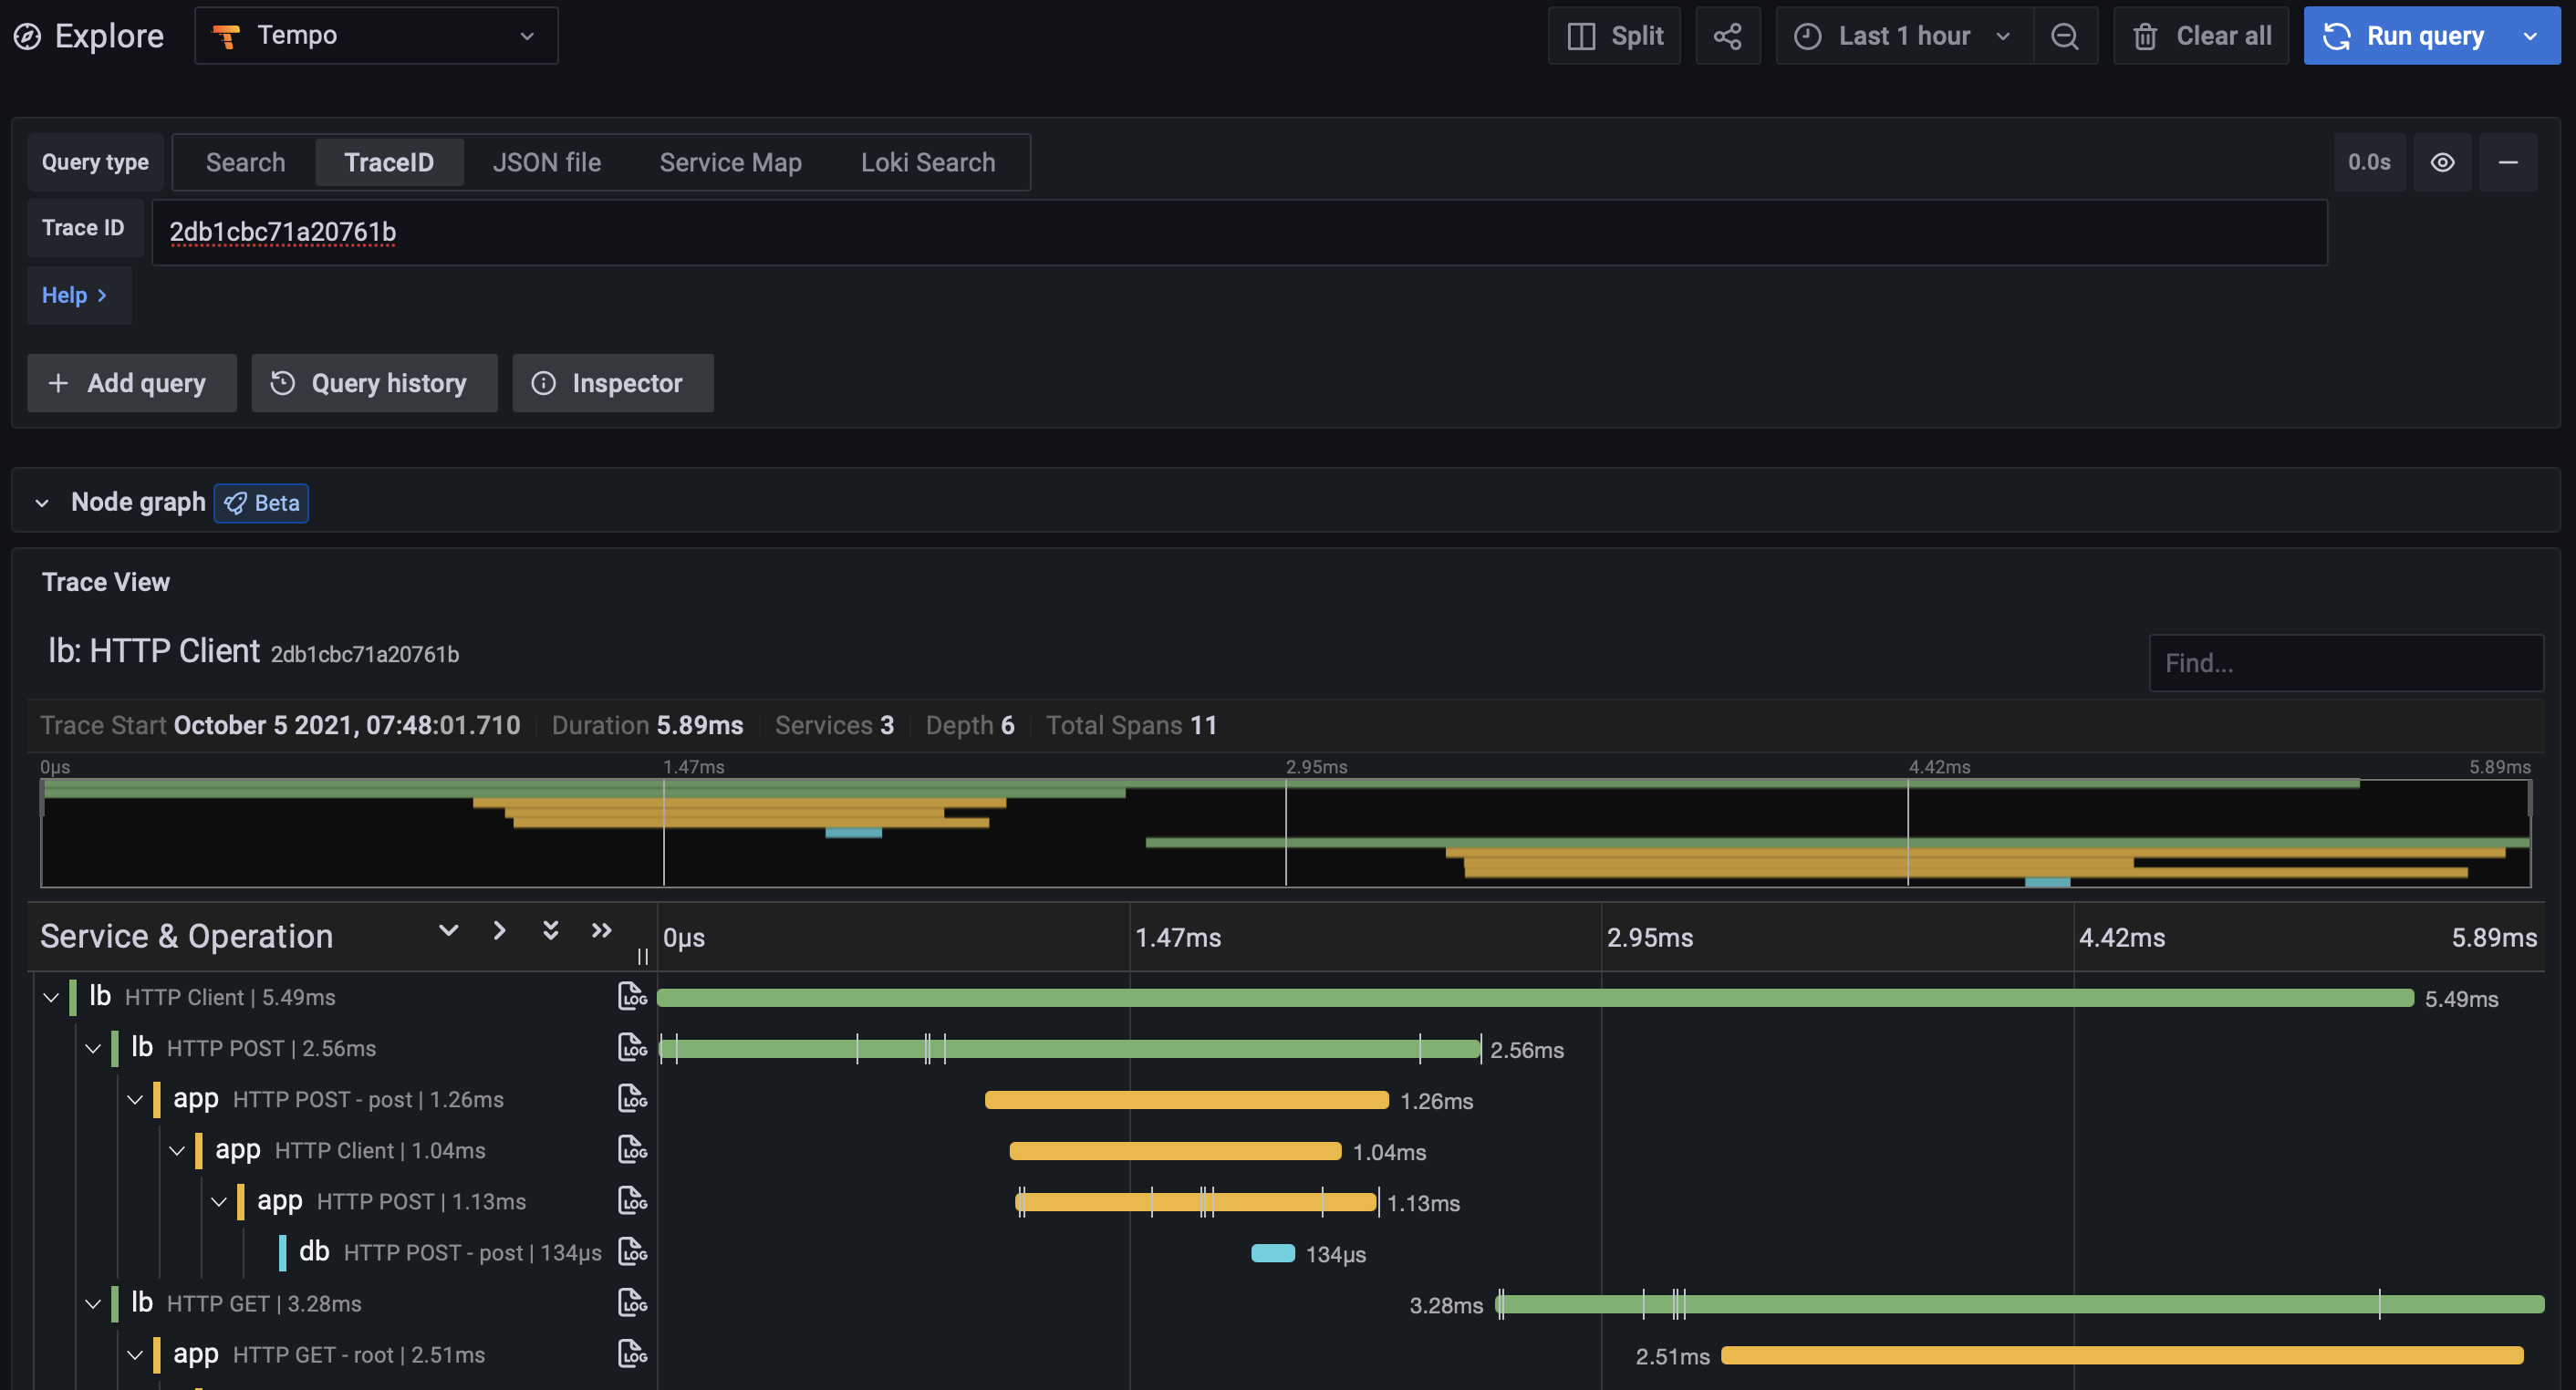
View trace by ID
The most basic functionality is to visualize a trace using its ID. Select the Trace ID tab and enter the ID to view it. This functionality is enabled by default and is available in all versions of Grafana.
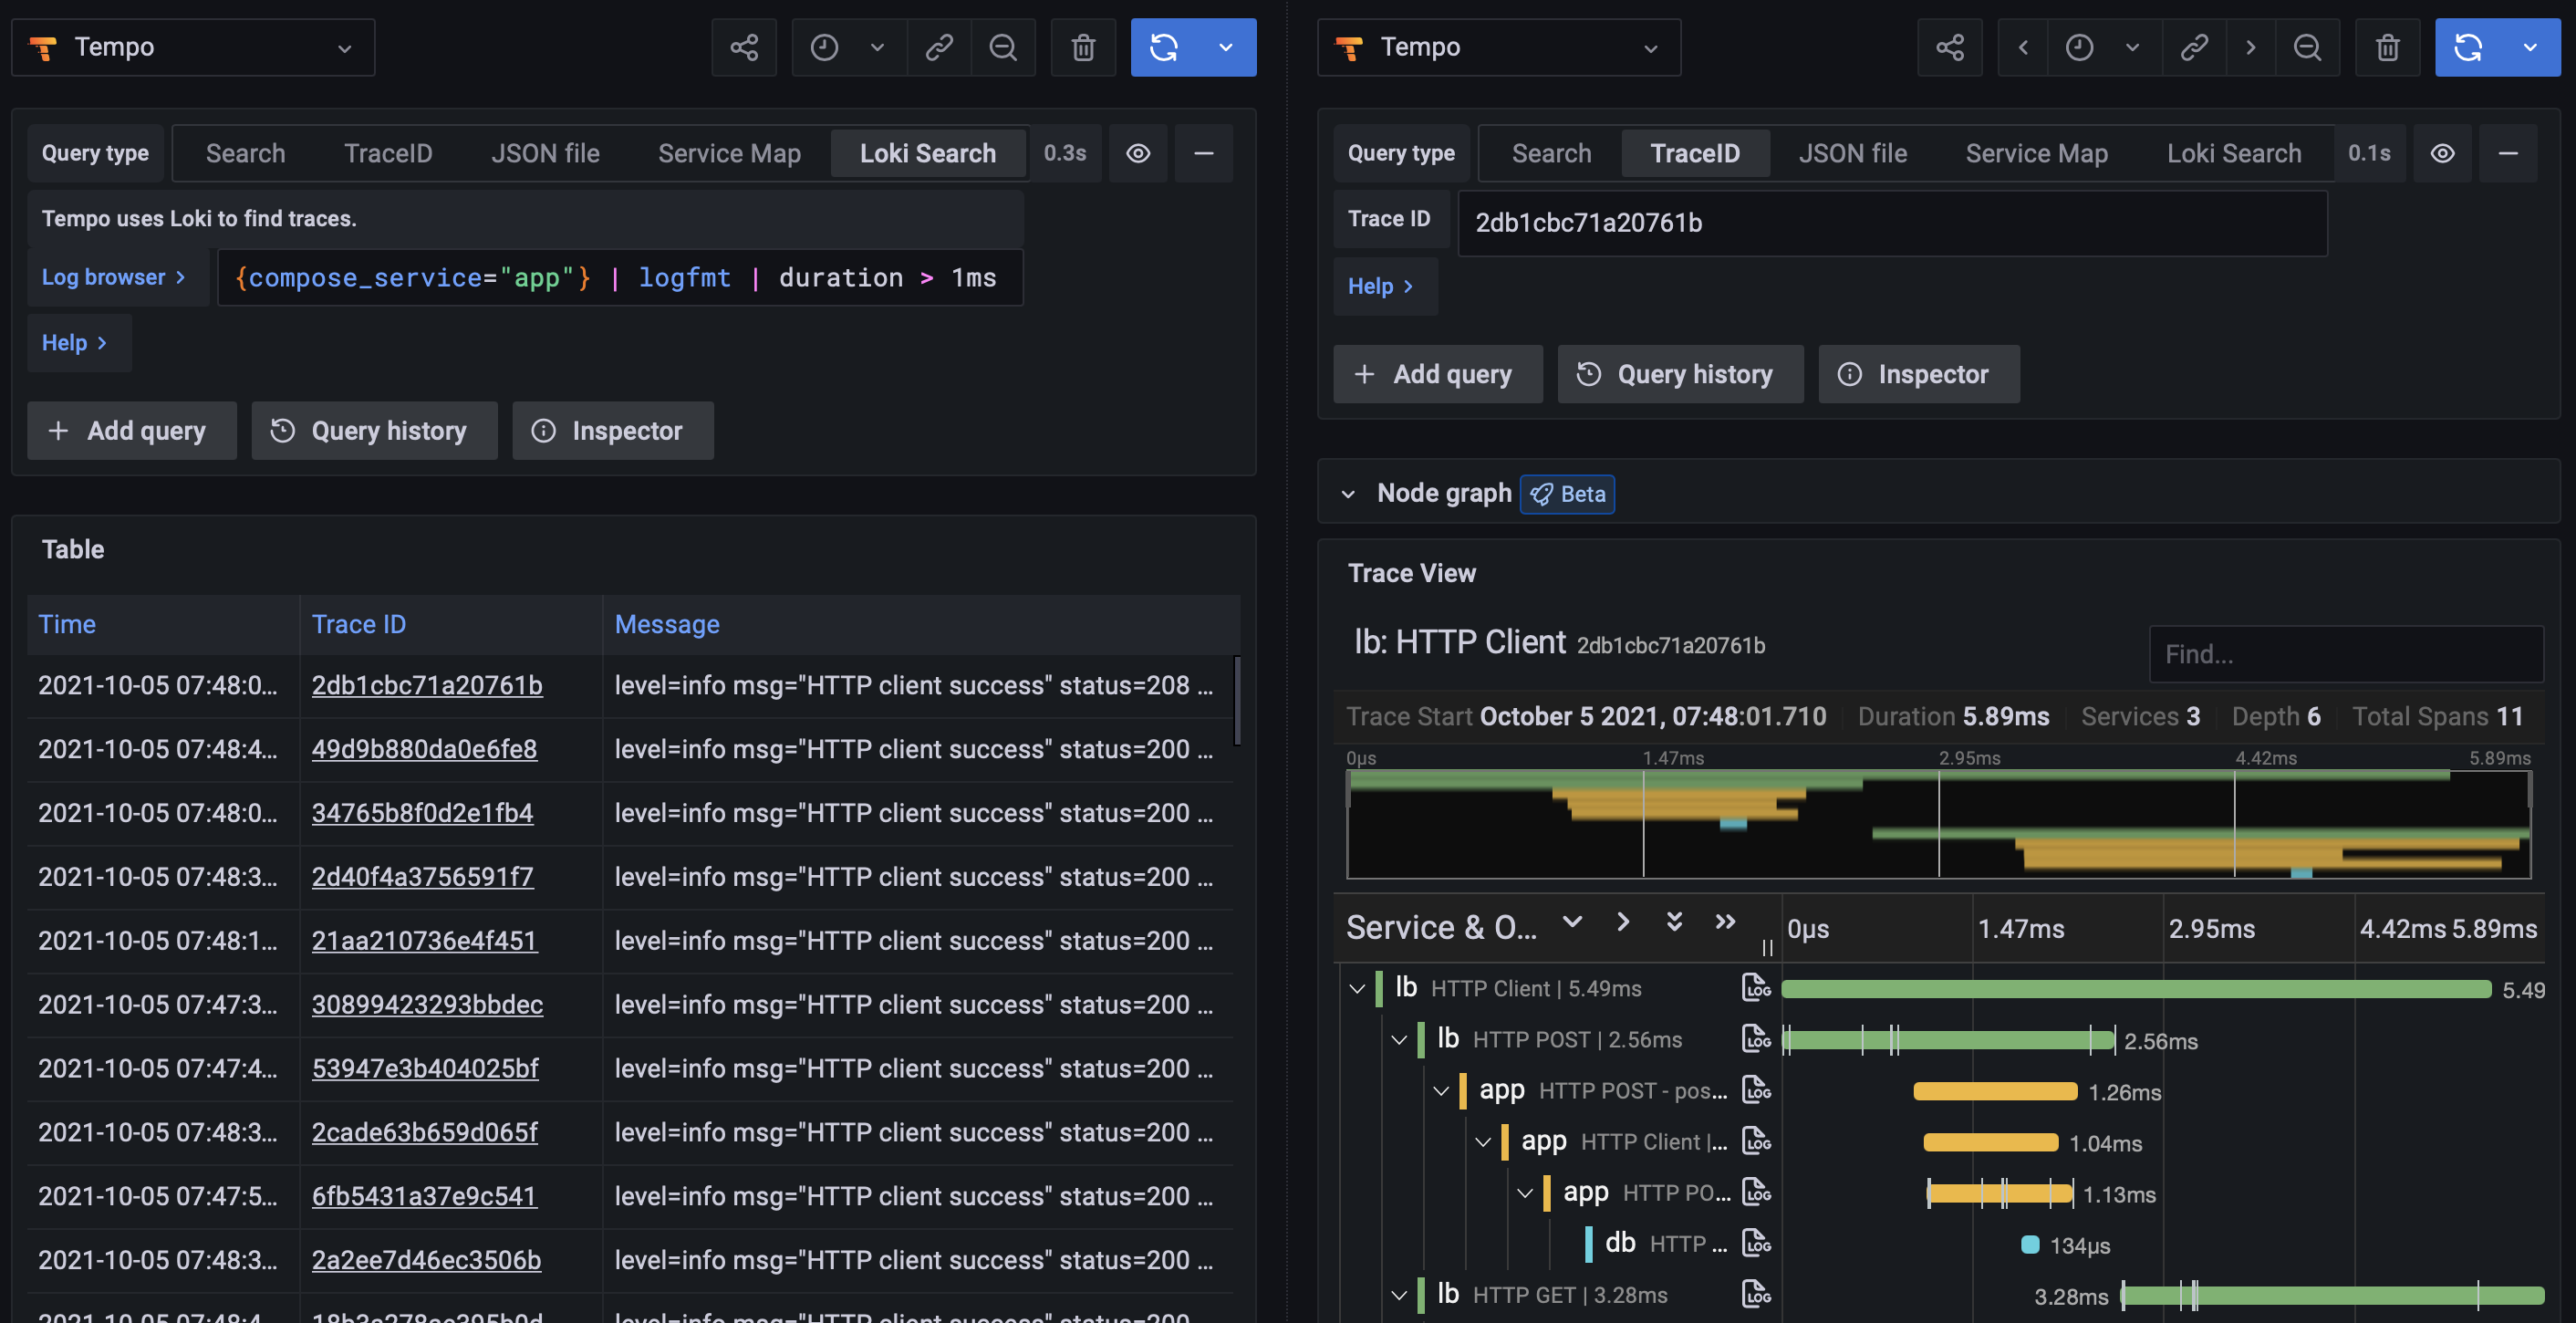
Log search
Traces can be discovered by searching logs for entries containing trace IDs. This is most useful when your application also logs relevant information about the trace that can also be searched, such as HTTP status code, customer ID, etc. This feature requires Grafana 7.5 or later, with a linked Loki data source, and a traceID derived field.
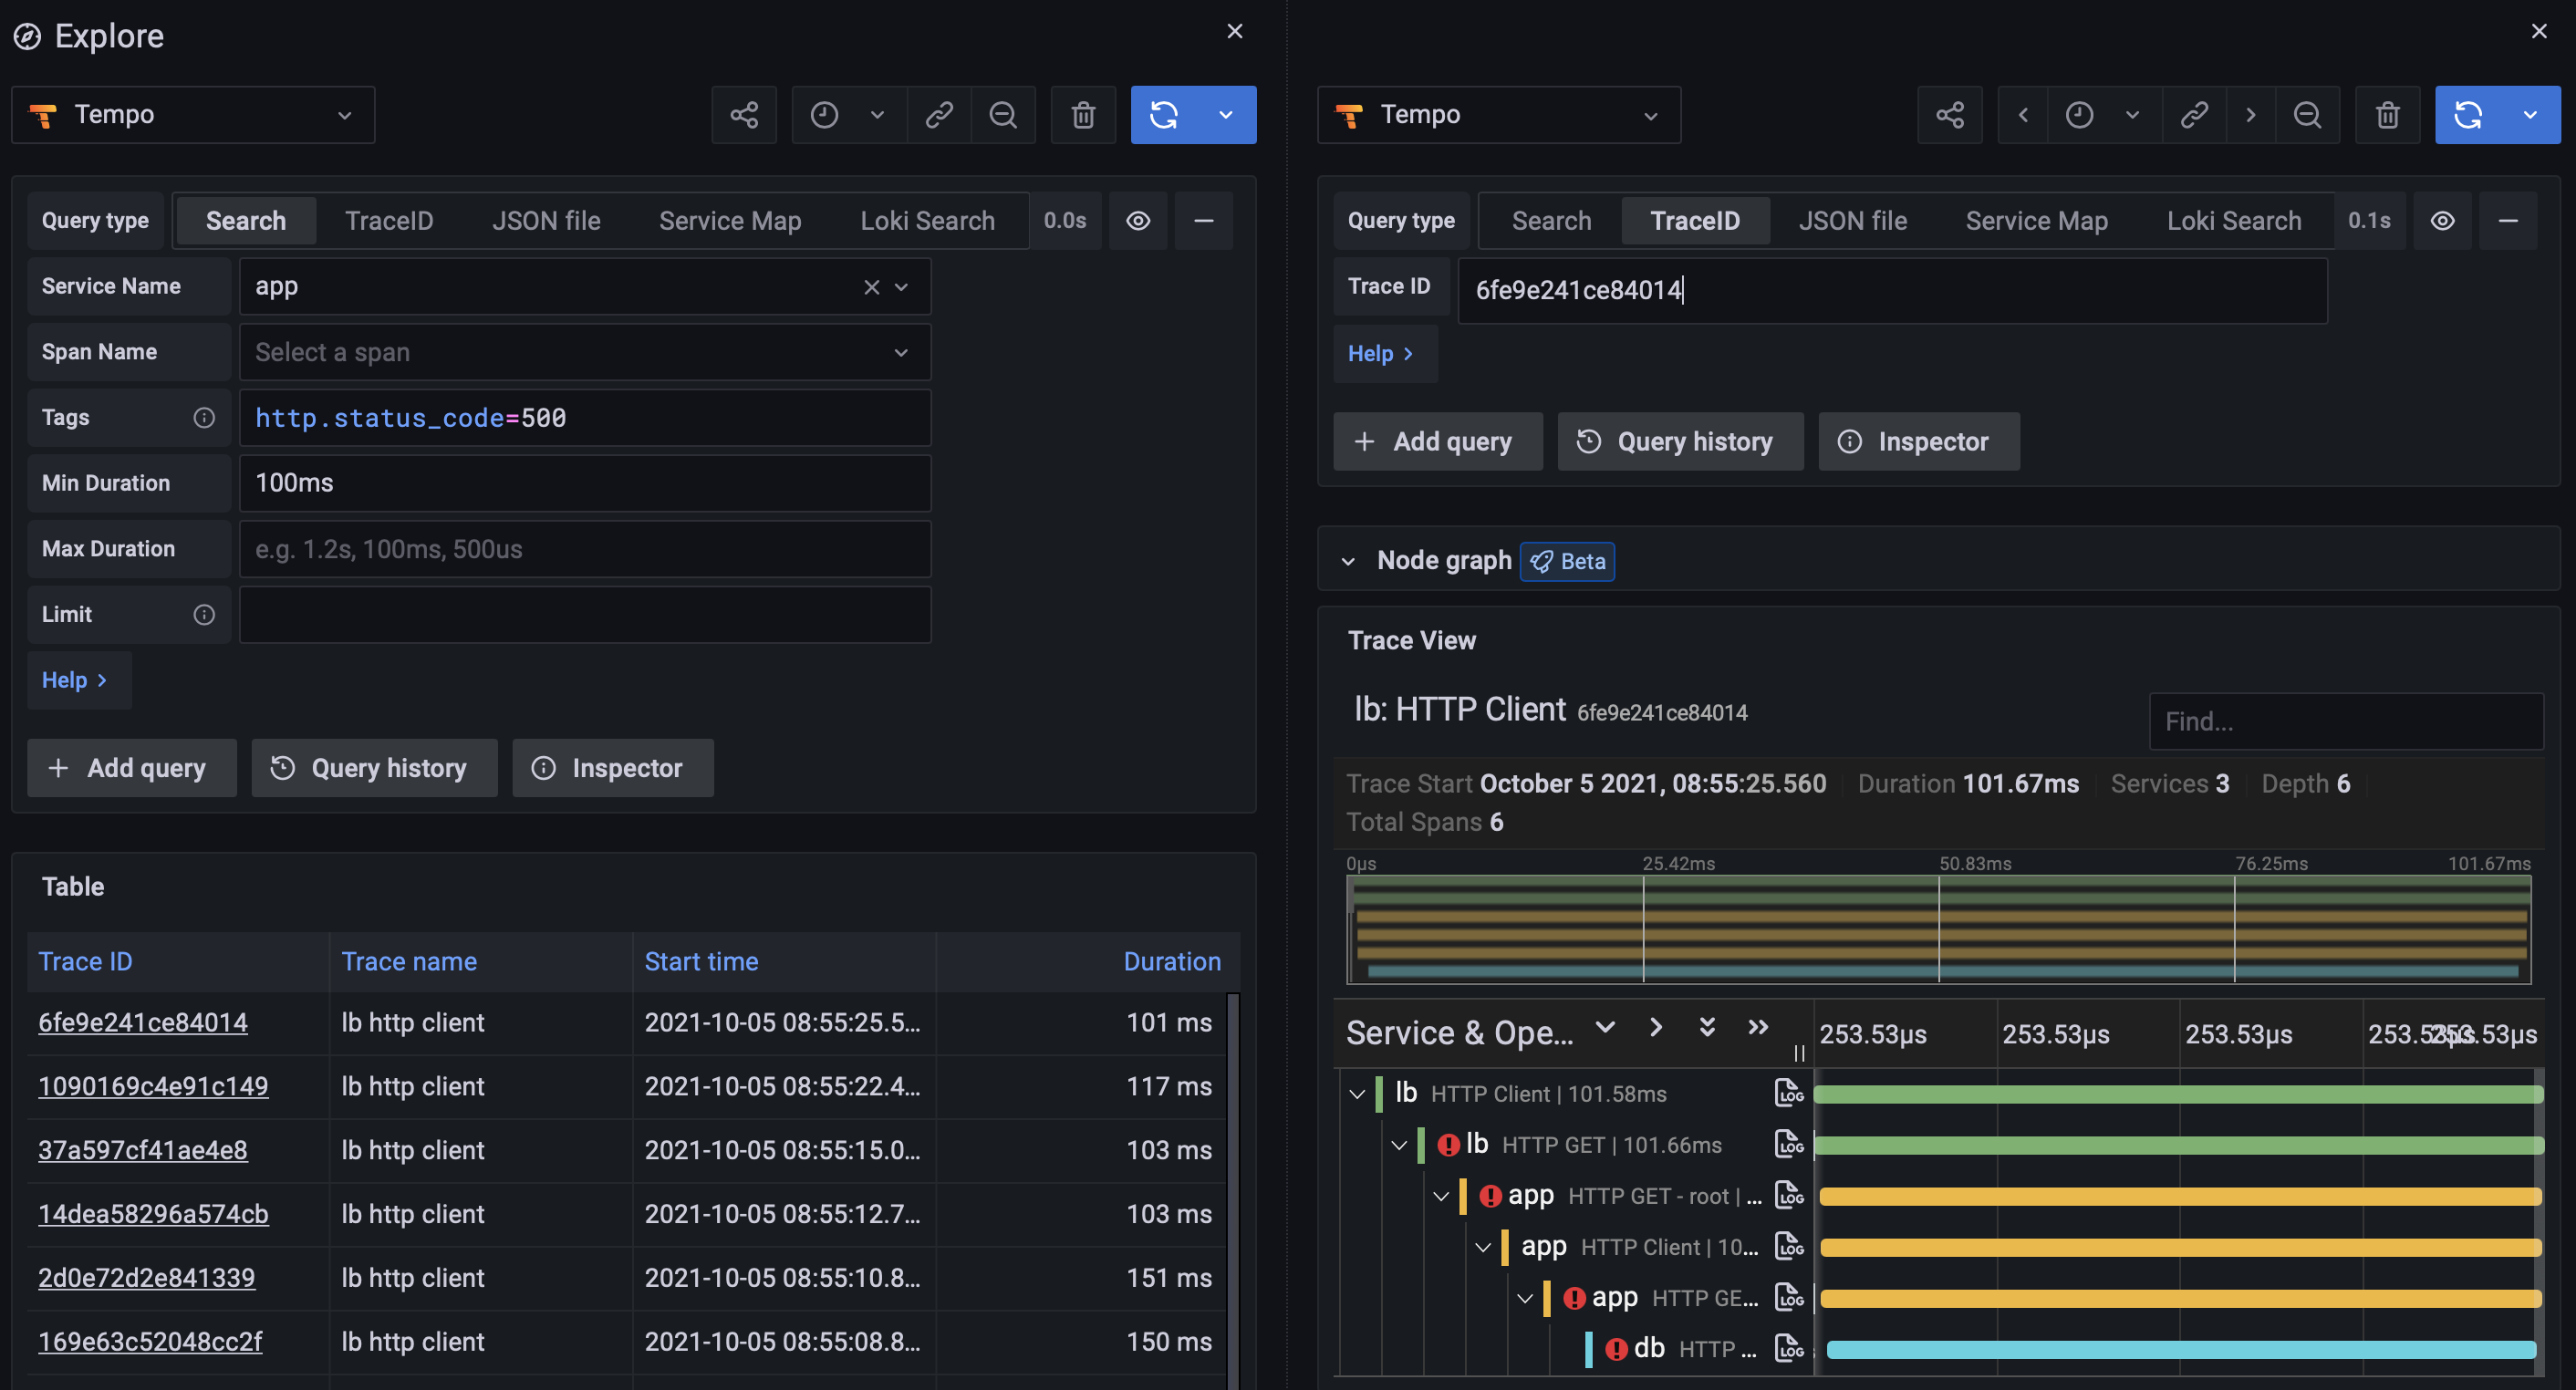
Find traces using Tempo search
Search for traces using common dimensions such as time range, duration, span tags, service names, and more. Use the trace view to quickly diagnose errors and high-latency events in your system.
Tempo includes the ability to search recent traces held in ingesters. Traces can be searched for data originating from a specific service, duration range, span, or process-level attributes included in your application’s instrumentation, such as HTTP status code and customer ID.
Non-deterministic search
Most search functions are deterministic: using the same search criteria results in the same results.
However, Tempo search is non-deterministic. If you perform the same search twice, you’ll get different lists, assuming the possible number of results for your search is greater than the number of results you have your search set to return.
When performing a search, Tempo does a massively parallel search over the given time range, and takes the first N results. Even identical searches will differ due to things like machine load and network latency. This approach values speed over predictability and is quite simple; enforcing that the search results are consistent would introduce additional complexity (and increase the time the user spends waiting for results).
Search of recent traces
Search of recent traces is disabled by default. Ingesters default to storing the last 15 minutes of traces.
To enable recent traces search:
- Run Tempo, enabling search in the YAML configuration. Refer to the search configuration documentation.
- Run Grafana 8.2 or a more recent version. Enable the
tempoSearchfeature toggle.
Search of the backend datastore
Tempo includes the the ability to search the entire backend datastore.
To enable search of the backend datastore:
Run Tempo, enabling search in the YAML configuration. Refer to the search configuration documentation. Further configuration information is in backend search. The Tempo configuration is the same for searching recent traces or for search of the backend datastore.
Run Grafana 8.3.6 or a more recent version. Enable the
tempoBackendSearchfeature toggle. This will cause Grafana to pass thestartandendparameters necessary for the backend datastore search.
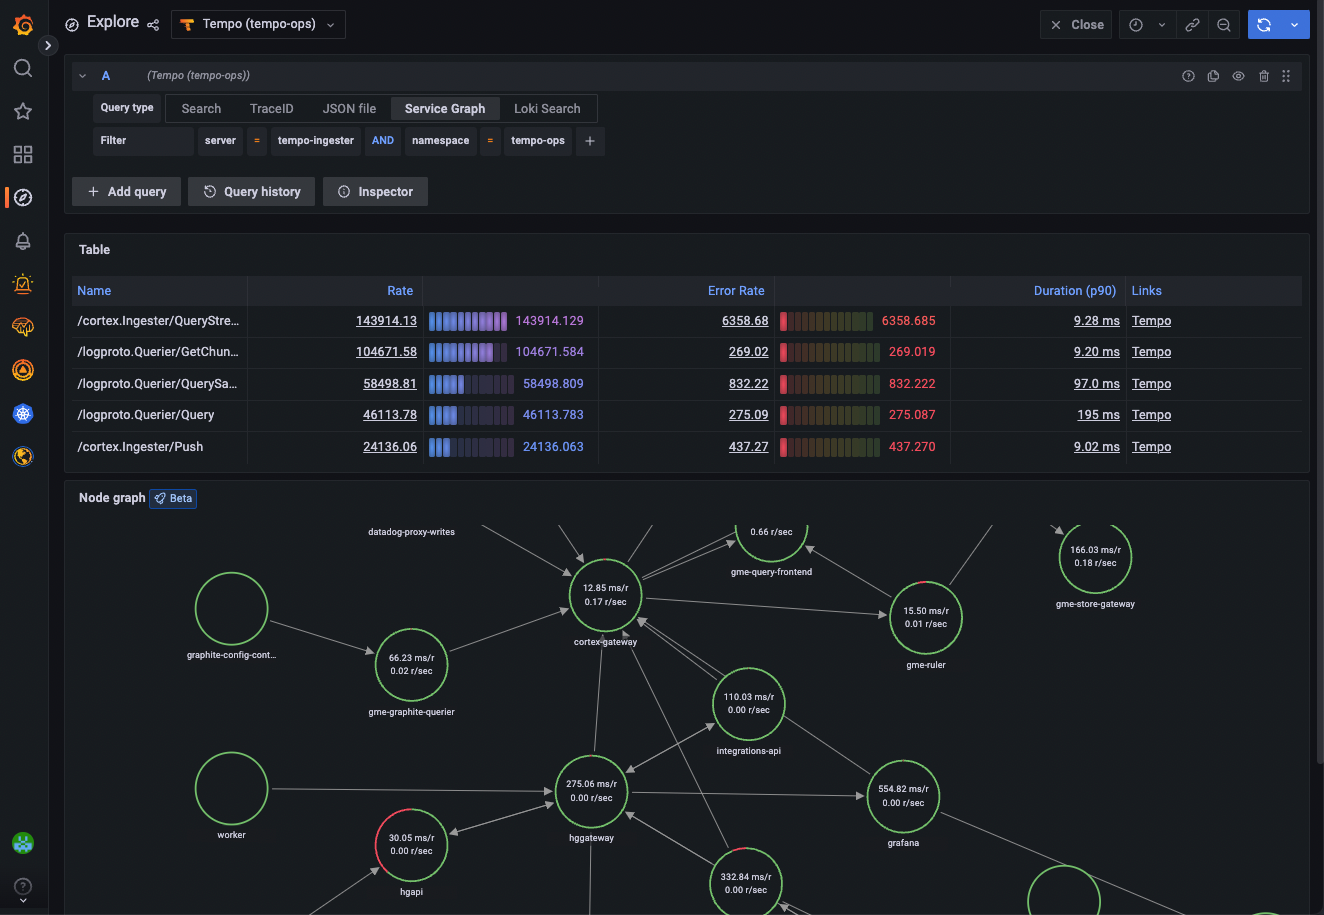
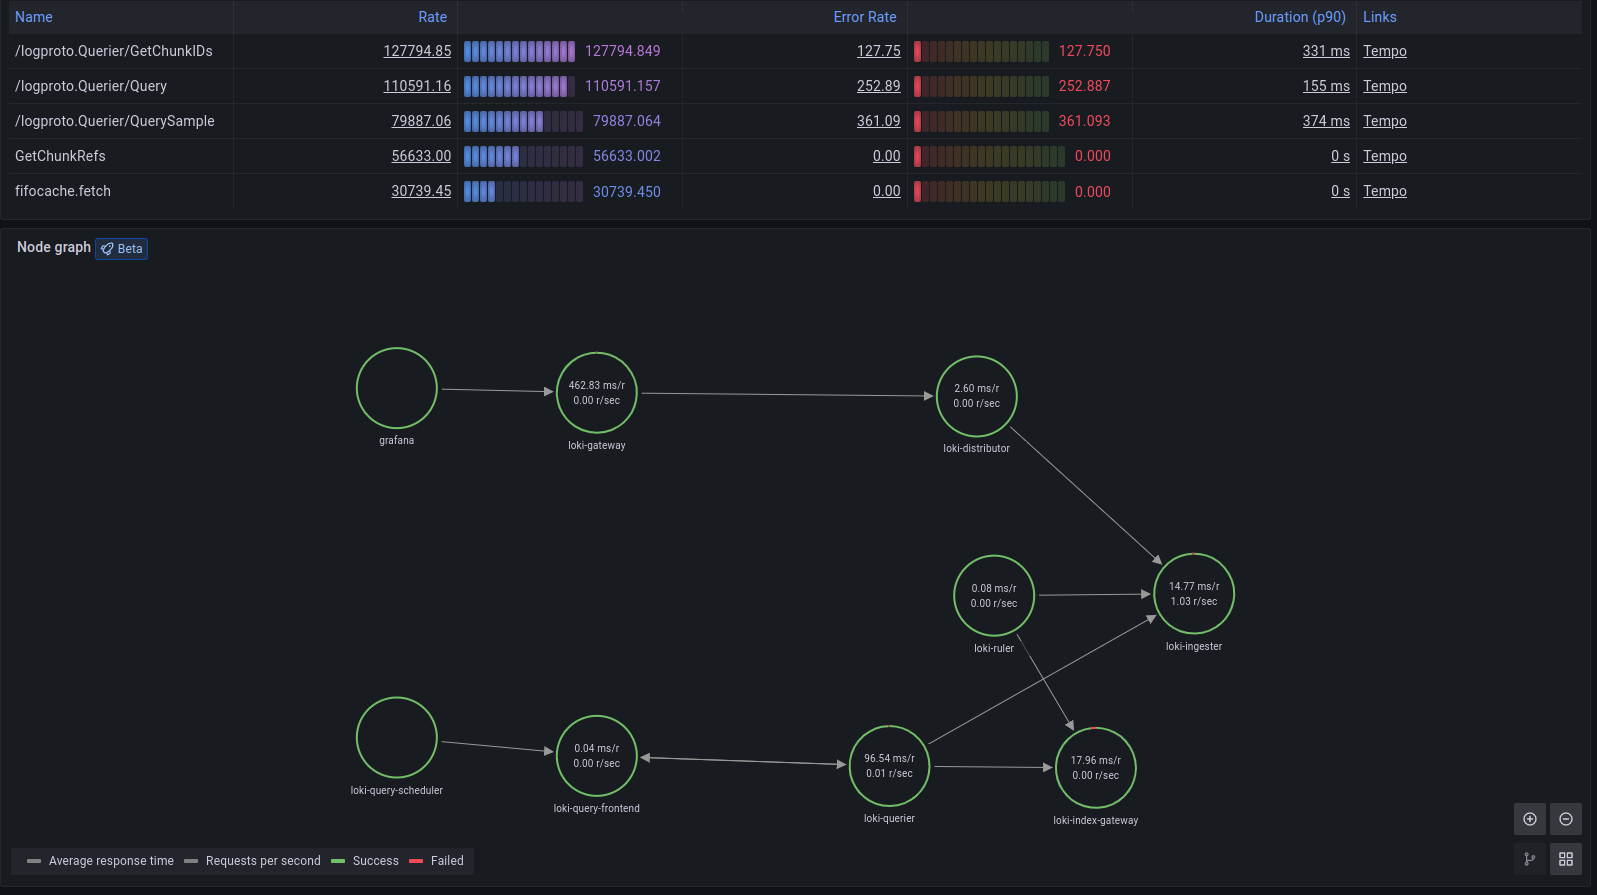
Service graph view
Grafana provides a built-in service graph view available in Grafana Cloud and Grafana 9.1. The service graph view visualizes the span metrics (traces data for rates, error rates, and durations (RED)) and service graphs. Once the requirements are set up, this pre-configured view is immediately available in Explore > Service Graphs.
For more information, refer to the service graph view.
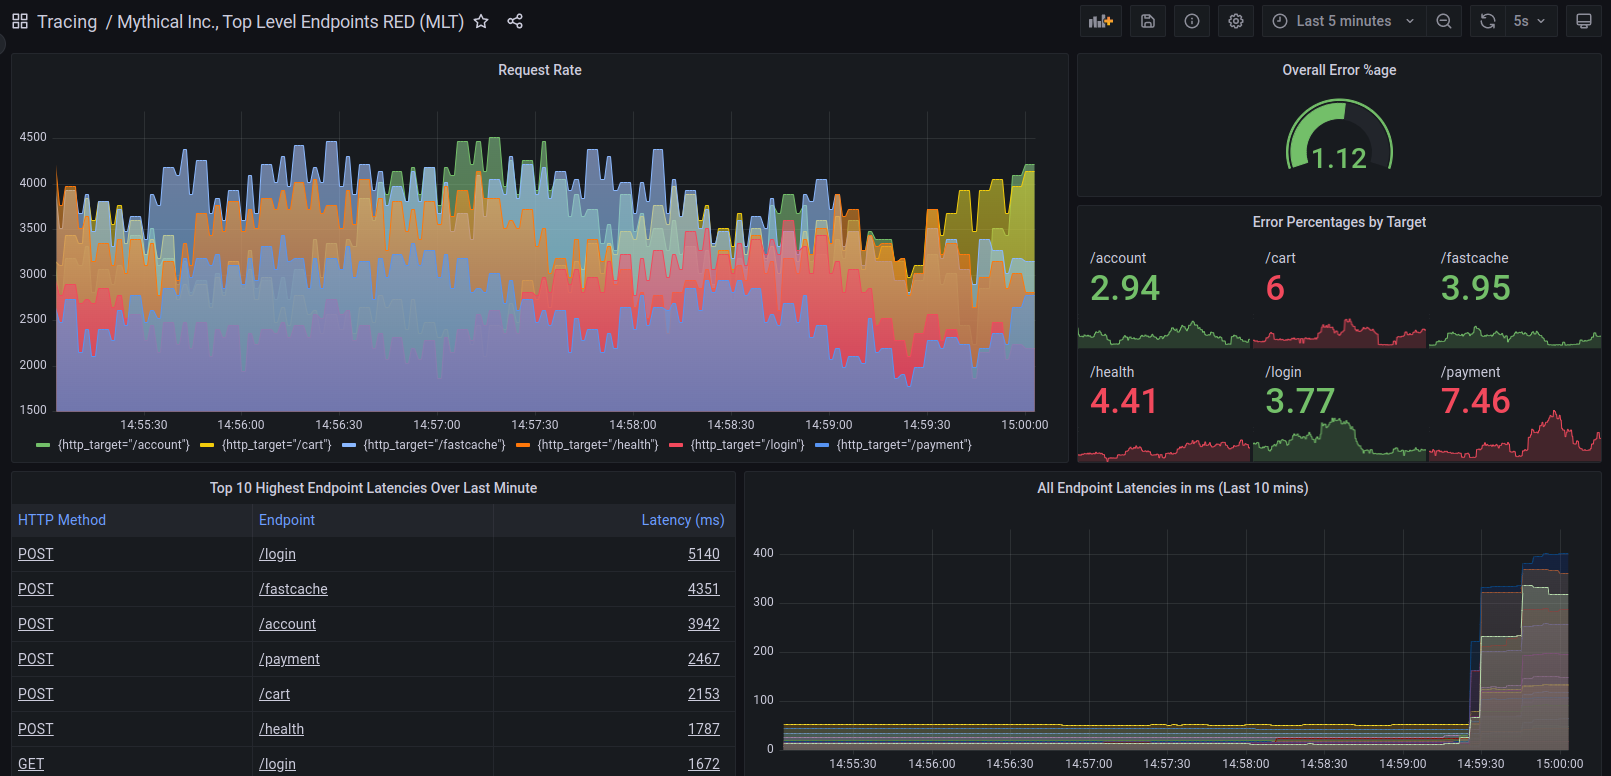
Metrics from spans
RED metrics can be used to drive service graphs and other ready-to-go visualizations of your span data. RED metrics represent:
- Rate, the number of requests per second
- Errors, the number of those requests that are failing
- Duration, the amount of time those requests take
For more information about RED method, refer to The RED Method: How to instrument your services.
Note: Metrics generation is disabled by default. Contact Grafana Support to enable metrics generation in your organization.
After the metrics generator is enabled in your organization, refer to Metrics-generator configuration for information about metrics-generator options.
These metrics exist in your Hosted Metrics instance and can also be easily used to generate powerful custom dashboards.
The metrics generator automatically generates exemplars as well which allows easy metrics to trace linking. Exemplars are GA in Grafana Cloud so you can also push your own.
View JSON file
A local JSON file containing a trace can be uploaded and viewed in the Grafana UI. This is useful in cases where access to the original Tempo data source is limited, or for preserving traces outside of Tempo. The JSON data can be downloaded via the Tempo API or the Inspector panel while viewing the trace in Grafana.
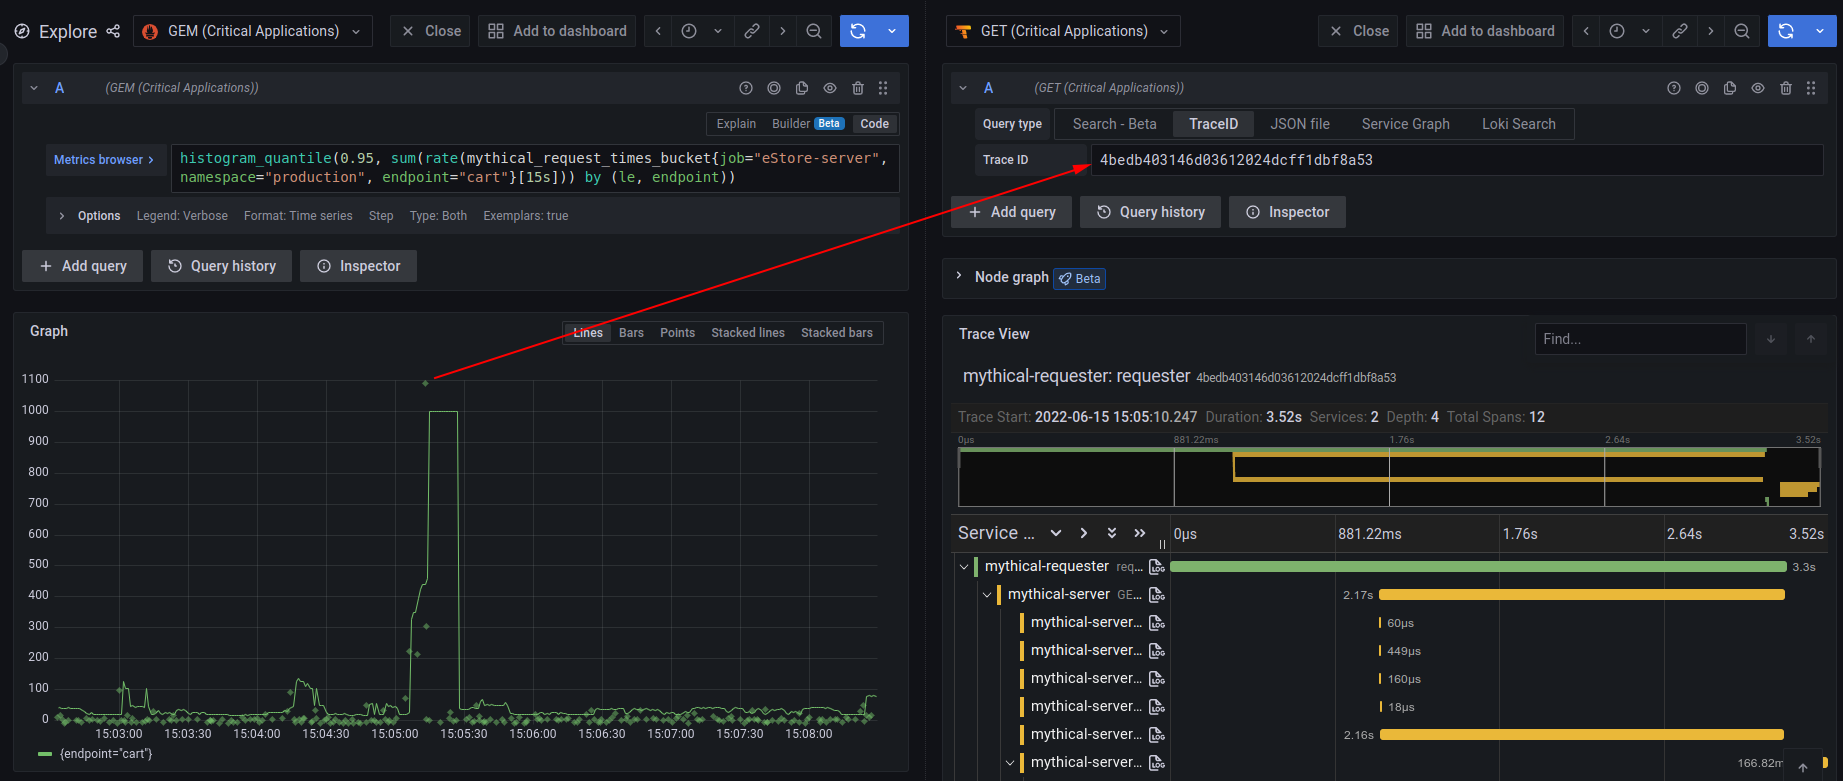
Linking traces and metrics
Grafana can correlate different signals by adding the functionality to link between traces and metrics. The trace to metrics feature, a beta feature in Grafana 9.1, lets you quickly see trends or aggregated data related to each span.
You can try it out by enabling the traceToMetrics feature toggle in your Grafana configuration file.
For example, you can use span attributes to metric labels by using the $__tags keyword to convert span attributes to metrics labels.
For more information, refer to the trace to metric configuration documentation.

