Important: This documentation is about an older version. It's relevant only to the release noted, many of the features and functions have been updated or replaced. Please view the current version.
Quick start for Tempo
The Tempo repository provides multiple examples to help you quickly get started using Tempo and tracing data.
Every example has a docker-compose.yaml manifest that includes all of the options needed to explore trace data in Grafana, including resource configuration and trace data generation. The Tempo examples running with docker-compose all include a version of Tempo and a storage configuration like Amazon S3 and GCS.
This quick start guide uses the local example. Any data is stored locally in the tempo-data folder. To learn more, read the local storage example README.
Before you begin
To follow this guide, you need:
- Git, Docker, and docker-compose plugin
Clone Tempo and start Docker
Clone the Tempo repository:
git clone https://github.com/grafana/tempo.gitGo into the examples directory:
cd tempo/example/docker-compose/localStart the services that are defined in the docker-compose file:
docker compose up -dVerify that the services are running using
docker compose ps. You should see something like:docker compose ps NAME COMMAND SERVICE STATUS PORTS local-grafana-1 "/run.sh" grafana running 0.0.0.0:3000->3000/tcp local-k6-tracing-1 "/k6-tracing run /ex…" k6-tracing running local-prometheus-1 "/bin/prometheus --c…" prometheus running 0.0.0.0:9090->9090/tcp local-tempo-1 "/tempo -config.file…" tempo running 0.0.0.0:3200->3200/tcp, 0.0.0.0:4317-4318->4317-4318/tcp, 0.0.0.0:9411->9411/tcp, 0.0.0.0:14268->14268/tcpAs part of the docker compose manifest, Grafana is now reachable on port 3000. Open a browser to localhost:3000 and sign in to Grafana.
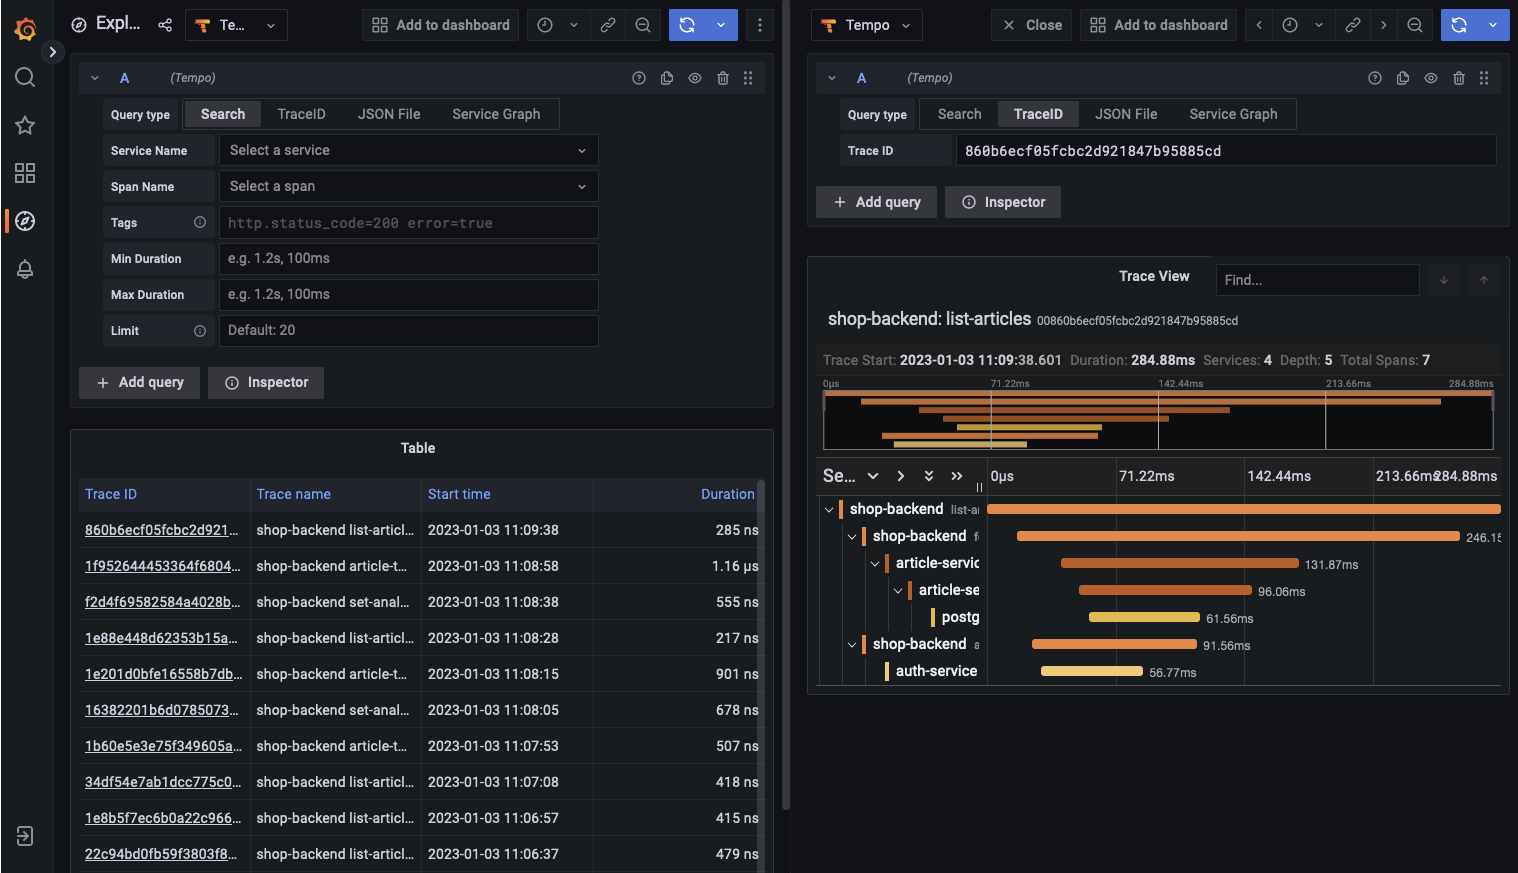
Once logged in, navigate to the Explore page, select the Tempo data source and select the Search tab. Select Run query to list the recent traces stored in Tempo. Select one to view the trace diagram:
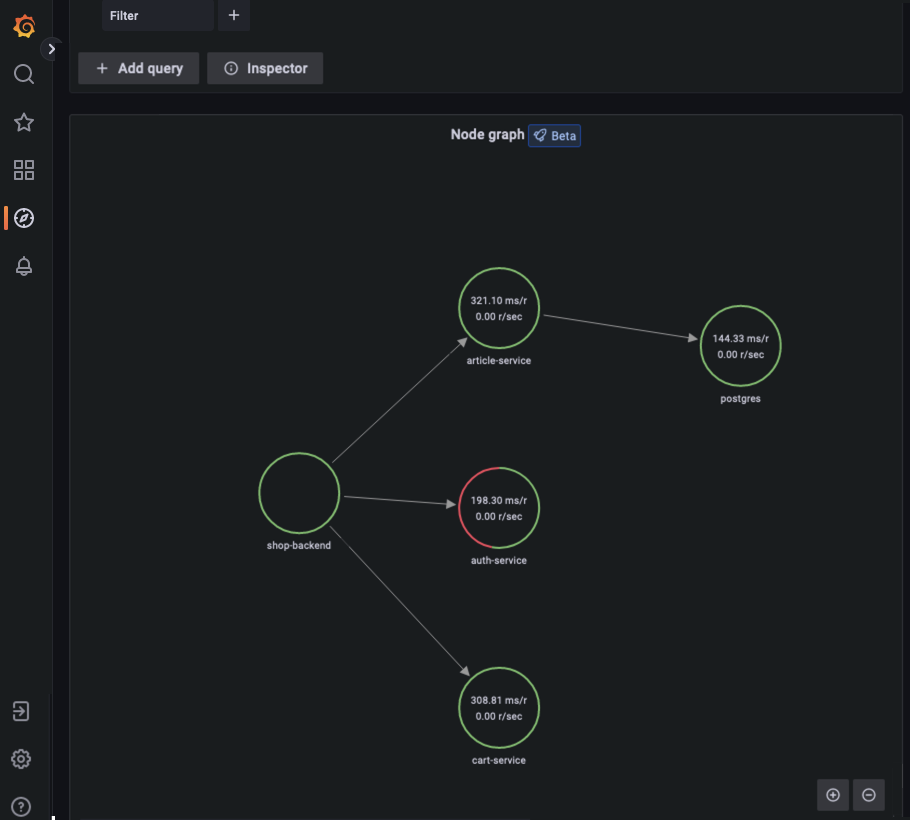
A couple of minutes after Tempo has successfully restarted, select the Service graph tab for the Tempo data source in the Explore page. Select Run query to view a service graph, generated by Tempo’s metrics-generator.
To stop the services:
docker-compose down -v
