Important: This documentation is about an older version. It's relevant only to the release noted, many of the features and functions have been updated or replaced. Please view the current version.
Pushing spans with HTTP
Sometimes using a tracing system is intimidating because it seems like you need complex application instrumentation or a span ingestion pipeline in order to push spans. This guide aims to show an extremely basic technique for pushing spans with http/json from a Bash script using the Zipkin receiver.
Starting Tempo
Let’s first start Tempo with the Zipkin receiver configured. In order to do this create a config file like so:
server:
  http_listen_port: 3200

distributor:
  receivers:
    zipkin:

storage:
  trace:
    backend: local
    local:
      path: /tmp/tempo/blocks
and run Tempo using it:
docker run -p 9411:9411 -p 3200:3200 -v $(pwd)/config.yaml:/config.yaml grafana/tempo:latest -config.file /config.yamlPushing spans
Now that Tempo is running and listening on port 9411 for Zipkin spans, let’s push a span to it using curl.
curl -X POST http://localhost:9411 -H 'Content-Type: application/json' -d '[{
 "id": "1234",
 "traceId": "0123456789abcdef",
 "timestamp": 1608239395286533,
 "duration": 100000,
 "name": "span from bash!",
 "tags": {
    "http.method": "GET",
    "http.path": "/api"
  },
  "localEndpoint": {
    "serviceName": "shell script"
  }
}]'
Note that the timestamp field is in microseconds and was obtained by running date +%s%6N. The duration field is also in microseconds and so 100000 is 100 milliseconds.
Retrieving traces
The easiest way to get the trace is to execute a simple curl command to Tempo. The returned format is OTLP.
curl http://localhost:3200/api/traces/0123456789abcdef
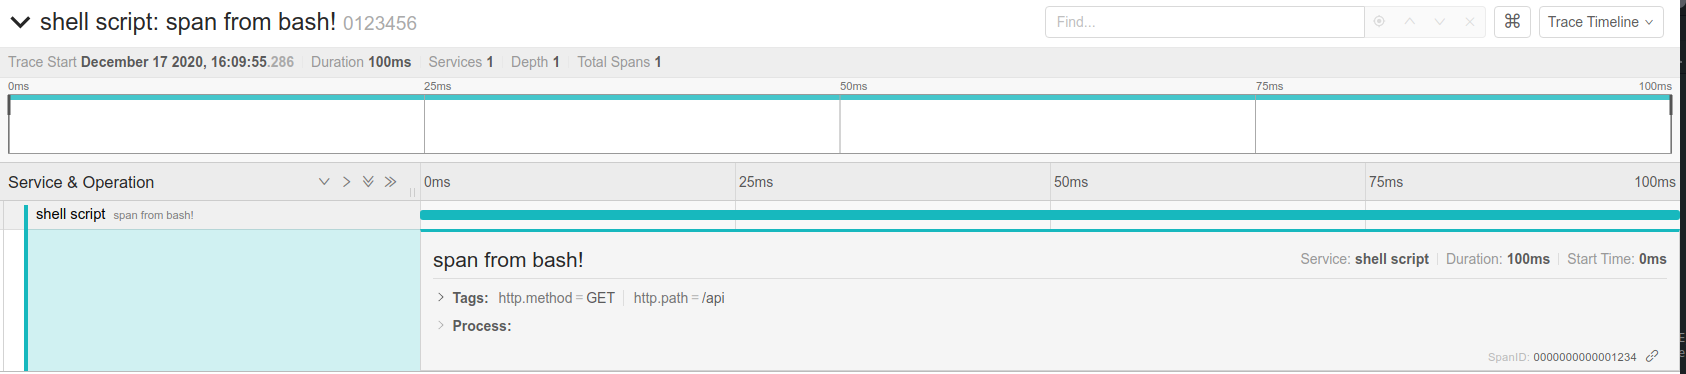
{"batches":[{"resource":{"attributes":[{"key":"service.name","value":{"stringValue":"shell script"}}]},"instrumentationLibrarySpans":[{"spans":[{"traceId":"AAAAAAAAAAABI0VniavN7w==","spanId":"AAAAAAAAEjQ=","name":"span from bash!","startTimeUnixNano":"1608239395286533000","endTimeUnixNano":"1608239395386533000","attributes":[{"key":"http.path","value":{"stringValue":"/api"}},{"key":"http.method","value":{"stringValue":"GET"}}]}]}]}]}However, staring at a json blob in bash is not very fun. Let’s start up Tempo query so we can visualize our trace. Tempo query is Jaeger Query with a GRPC Plugin that allows it to query Tempo.
docker run --env BACKEND=localhost:3200 --net host grafana/tempo-query:latestAnd open http://localhost:16686/trace/0123456789abcdef in the browser of your choice to see:
More spans
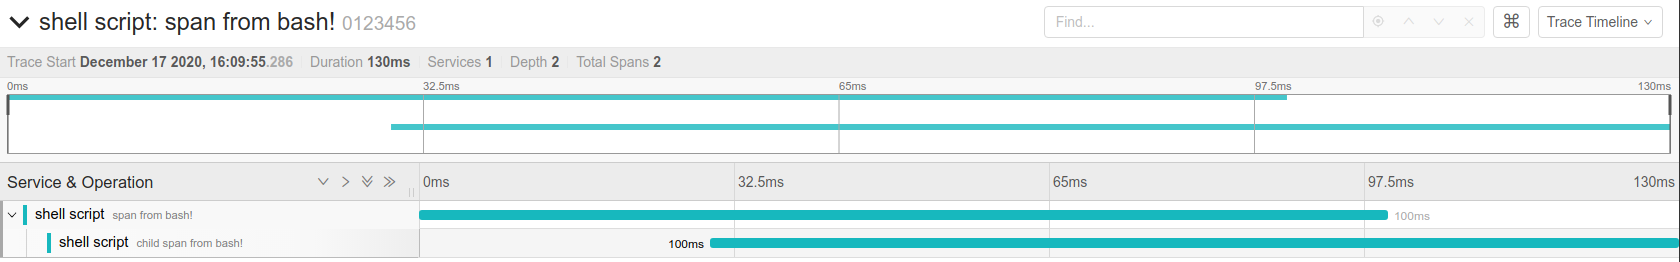
Now that we have the basics down, it’s easy to continue building our trace. By specifying the same trace ID and a parent span ID, we can start building a trace.
curl -X POST http://localhost:9411 -H 'Content-Type: application/json' -d '[{
 "id": "5678",
 "traceId": "0123456789abcdef",
 "parentId": "1234",
 "timestamp": 1608239395316533,
 "duration": 100000,
 "name": "child span from bash!",
  "localEndpoint": {
    "serviceName": "shell script"
  }
}]'
And now the UI shows:
Spans from everything!
Tracing is not limited to enterprise languages with complex frameworks. As you can see it’s easy to store and track events from your js, python or bash scripts. You can use Tempo/distributed tracing today to trace CI pipelines, long running bash processes, python data processing flows or anything else you can think of.
Happy tracing!

