This is documentation for the next version of Grafana Tempo documentation. For the latest stable release, go to the latest version.
Troubleshoot Grafana Alloy
Sometimes it can be difficult to tell what, if anything, Grafana Alloy is sending along to the backend. This document focuses on a few techniques to gain visibility on how many trace spans push to Alloy and if they’re making it to the backend. OpenTelemetry Collector form the basis of the tracing pipeline, which does a fantastic job of logging network and other issues.
If your logs are showing no obvious errors, one of the following suggestions may help.
Metrics
Alloy publishes a few Prometheus metrics that are useful to determine how much trace traffic it receives and successfully forwards. These metrics are a good place to start when diagnosing tracing Alloy issues.
From the
otelcol.receiver.otlp component:
receiver_accepted_spans_ratio_total
receiver_refused_spans_ratio_total
From the
otelcol.exporter.otlp component:
exporter_sent_spans_ratio_total
exporter_send_failed_spans_ratio_total
Alloy has a Prometheus scrape endpoint, /metrics, that you can use to check metrics locally by opening a browser to http://localhost:12345/metrics.
The /metrics HTTP endpoint of the Alloy HTTP server exposes the Alloy component and controller metrics.
Refer to the
Monitor the Grafana Alloy component controller documentation for more information.
Check metrics in Grafana Cloud
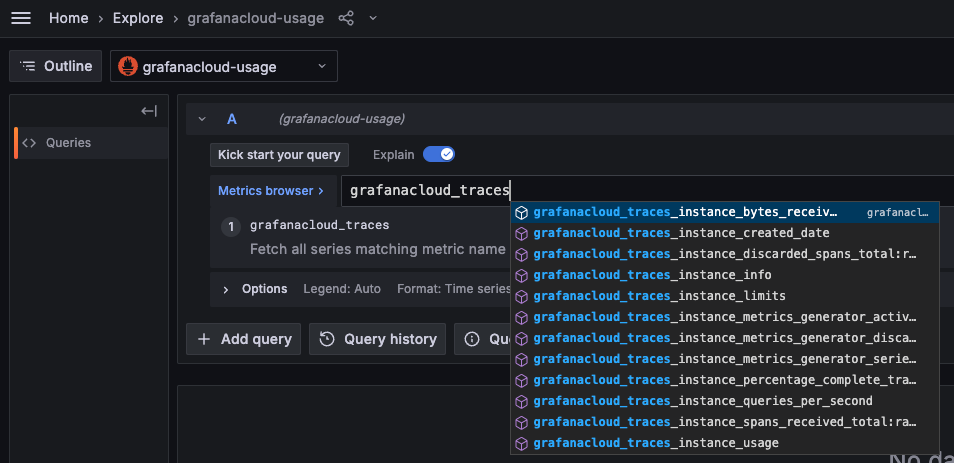
In your Grafana Cloud instance, you can check metrics using the grafanacloud-usage data source.
To view the metrics, use the following steps:
- From your Grafana instance, select Explore in the left menu.
- Change the data source to
grafanacloud-usage. - Type the metric to verify in the text box. If you start with
grafanacloud_traces_, you can use autocomplete to browse the list of available metrics.
Refer to Cloud Traces usage metrics for a list of metrics related to tracing usage.

Trace span logging
If metrics and logs are looking good, but you are still unable to find traces in Grafana Cloud, you can configure Alloy to output all the traces it receives to the console.


