Service graph view
Grafana’s service graph view uses metrics generated by the metrics-generator or Grafana Alloy to display span request rates, error rates, and durations, as well as service graphs. Once the requirements are set up, this pre-configured view is immediately available.
Using the service graph view, you can:
- Discover spans which are consistently erroring and the rates at which they occur
- Get an overview of the overall rate of span calls throughout your services
- Determine how long the slowest queries in your service take to complete
- Examine all traces that contain spans of particular interest based on rate, error, and duration values (RED signals)

Requirements
You have to enable span metrics and service graph generation on the Grafana backend so metrics that are generated as traces are ingested.
To use the service graph view, you need:
- Tempo or Grafana Cloud Traces with either the metrics generator enabled and configured or Grafana Alloy enabled and configured to send data to a Prometheus-compatible metrics store
- Services graphs, which are enabled by default in Grafana
- Span metrics enabled in your Tempo data source configuration
The service graph view can be derived from metrics generated by either the metrics-generator or Grafana Alloy.
For information on how to configure these features, refer to the Tempo data sources documentation.
What does the service graph view show?
Using this view, you can see the top five spans with a type of server (listed in the Name column).
You can refine any of this data using the filters.
Selecting any of the data points lets you see more specific data.
The service graph view provides a span metrics visualization (table) and service graph (node map). In addition, you can use the filters to customize the data displayed.
You can select any information in the table that has an underline to show more detailed information. You can also select any node in the service graph to display additional information.
Error rate example
Let’s say you want to learn more about why cortex.Ingester has the highest error rates.
Selecting the second row of the Error rate column displays details about the span metrics in a new window on the right side.
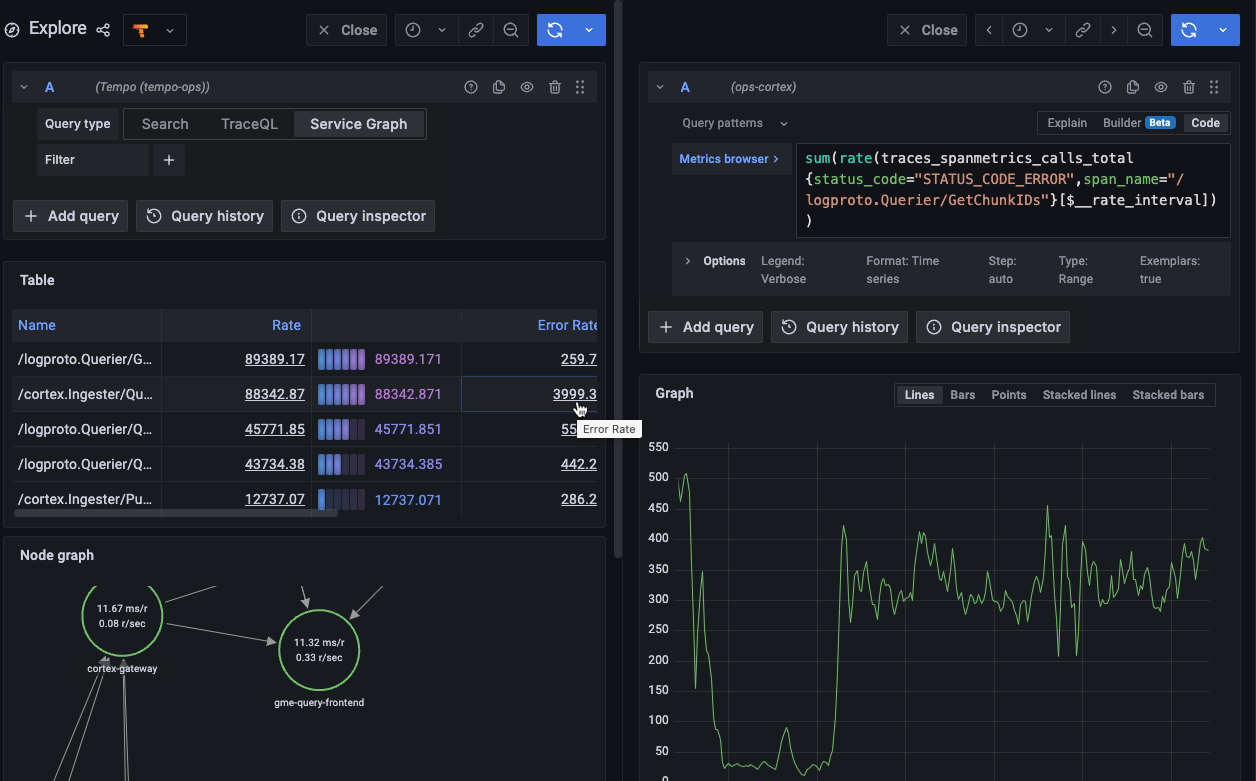
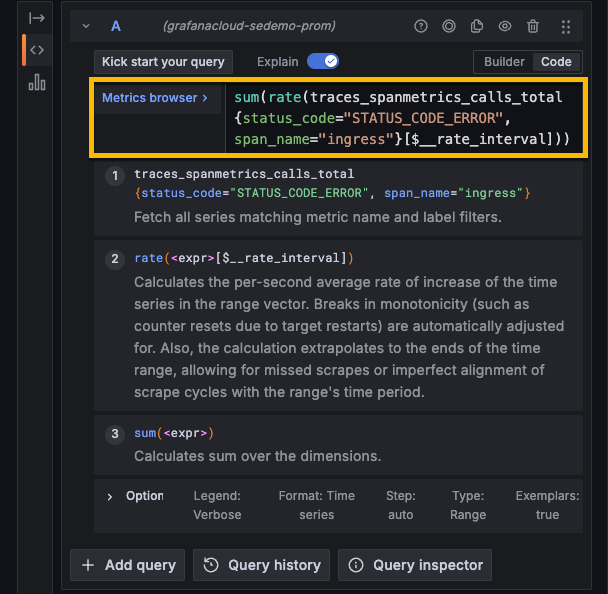
The metrics query used to generate the data appears in the Metrics browser field.
Span metrics table
The span metrics, shown in the table, are generated by the metrics-generator or Grafana Alloy. These metrics are created from ingested tracing data, including RED metrics.
Span metrics generate two metrics:
- A counter that computes requests
- A histogram that tracks the distribution of durations of all requests
For information about span metrics and how they are calculated, refer to the Span metrics documentation.
Table contents
The span metrics table contains seven columns with five column headings. Selecting a heading sorts the data by ascending or descending values.
Service graphs
A service graph (node graph) is a visual representation of the interrelationships between various services. Service graphs help to understand the structure of a distributed system, and the connections and dependencies between its components.
Service graphs infer the topology of a distributed system, provide a high level overview of the health of your system, and a historic view of a system’s topology. Service graphs show error rates and latencies, among other relevant data. The service graph layout can be the default or grid.

If you are using the metrics-generator, then it processes traces and generates service graphs in the form of time series metrics like:
traces_service_graph_request_total{client="app", server="db"} 20For information about service graphs and how they are calculated, refer to the Service Graphs documentation.
Use filters to reveal details
The service graph view uses service graphs and span metrics to provide a gateway to your tracing information. This dashboard is derived from a fixed set of metrics queries. These underlying queries can not be changed. However, you can choose which traces are included in the metrics query by filtering.
You can explore data by clicking on selectable items or by using filters.
Select items or nodes for more detail
Clicking on selectable items, such as underlined text in the table or nodes on the service graph, lets you reveal specific details based upon your selection.
In the table, you can select items in the Rate, Error Rate, Duration (p90), and Links columns. Choosing one of these items provides details about the span metrics.
You can view request rate, request histogram, failed request rate, and traces for any node in the service graph. To view more information, select the node in the service graph and then choose an option from the popup. For details on navigating the service graph, refer to the Node graph panel documentation.
Filter with metric queries
Using the filters at the top of the screen, you can narrow the data set based upon span attributes (key-value pairs or labels). The filters build a query to refine what is shown in the service graph and span metrics. You can add one or more label filters.
To use the filters:
At the top of the Service Graph, select the text box after Filter to display a list of available labels.
Select or search for a value for the label. In this case, the value of server is equal to tempo-ingester. The default operator is equals (=).
Optional: Change the operator by selecting = and choosing a new option from the drop-down.
Optional: Add additional key-value pairs to refine the data set. Any subsequent label filters use AND, which requires both key-value pairs to be presents for matches.
Select Run query.
Filters can be removed by selecting the filter drop-down and choosing – remove filter –.
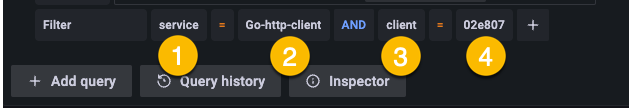
Each field or label represents a key-value pair. Number 1 selects a service as the label whose value is Go-http-client (2). The second key-value pair has a client as a label whose value is 02e807.
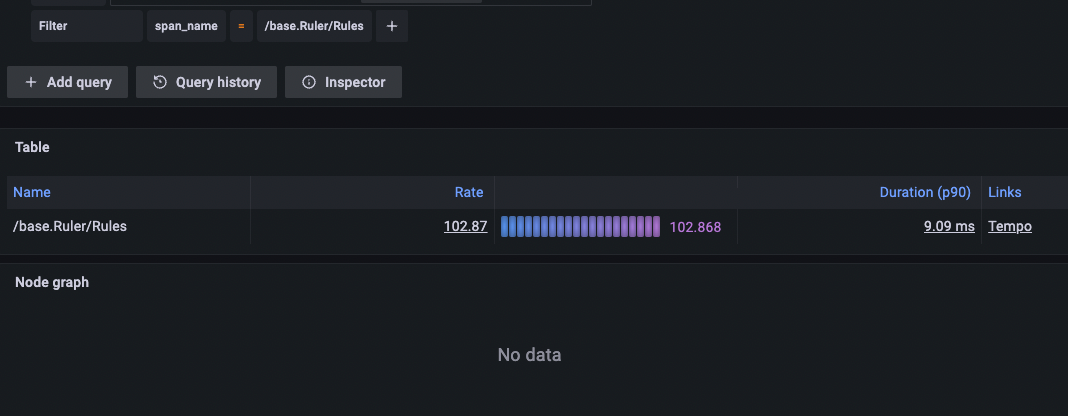
If your metrics queries are too specific, they may not return any results.
Updating the filter to be less specific returns a result. In this case, the results show only span metrics data associated with the span_name label with a value of /base.Ruler/Rules. No service graph data was available.