
Metrics from traces
Metrics provide a powerful insight into the systems you are monitoring with your observability strategy. Instead of running an additional service to generate metrics, you can use Grafana Tempo to generate metrics from traces.
Grafana Tempo can generate metrics from tracing data using the metrics-generator, TraceQL metrics (experimental), and the metrics summary API (deprecated). Refer to the table for a summary of these metrics and their capabilities. Metrics summary isn’t included in the table because it’s deprecated.
Metrics-generator
Tempo can generate metrics from ingested traces using the metrics-generator, an optional Tempo component. The metrics-generator runs two different processors: service graphs and span metrics.
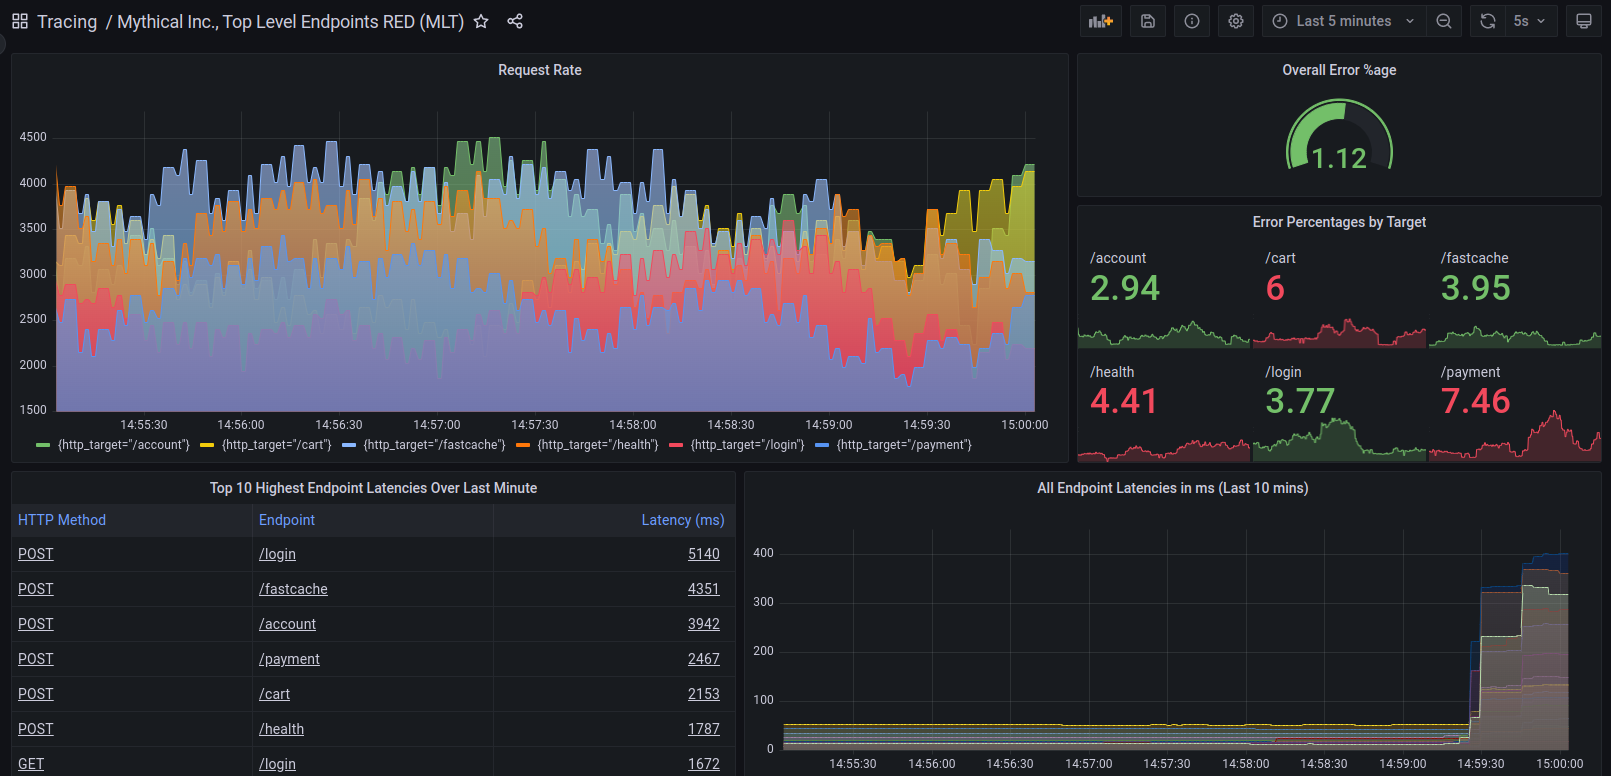
The metrics-generator looks at incoming spans, and calculates rate, error, and duration (RED) metrics from them, which it then writes to a time series database like Prometheus. By querying Prometheus, you can see the overall request rate, erroring request rate, and distribution of request latency in your system. By using the labels on those metrics, you can get a more granular view of request rate, error rate, and latency at a per-service, per-namespace, or per-operation level.
The metrics-generator generates metrics from tracing data using the services_graphs, span_metrics, and local_blocks processors.
The service_graphs and span_metrics processors generate metrics that are written to a Prometheus-compatible backend.
The local_blocks processor adds support for TraceQL metrics and provides the capability of answering TraceQL metric queries to the generators without writing any data to the Prometheus backend.
The metrics-generator processes spans and write metrics using the Prometheus remote write protocol.
For more information, refer to Metrics generator.
Use-cases for span metrics
Span metrics are of particular interest if your system isn’t monitored with metrics but it has distributed tracing implemented. You get out-of-the-box metrics from your tracing pipeline.
Note
In Grafana Cloud, the metrics-generator is disabled by default. Contact Grafana Support to enable metrics generation in your organization.
After the metrics-generator is enabled in your organization, refer to Metrics-generator configuration for information about metrics-generator options.

These metrics exist in your Hosted Metrics instance and can also be used to generate powerful custom dashboards.
The metrics-generator automatically generates exemplars as well which allows easy metrics to trace linking. Exemplars are available in Grafana Cloud.

TraceQL metrics (public preview)
Traces are a unique observability signal that contain causal relationships between the components in your system.
- Do you want to know how many database calls across all systems are downstream of your application?
- What services beneath a given endpoint are currently failing?
- What services beneath an endpoint are currently slow?
TraceQL metrics can answer all these questions by parsing your traces in aggregate.
You can query data generated by TraceQL metrics in a similar way that you would query results stored in Prometheus, Grafana Mimir, or other Prometheus-compatible Time-Series-Database (TSDB). TraceQL metrics queries allows you to calculate metrics on trace span data on-the-fly with Tempo (your tracing database), without requiring a time-series-database like Prometheus.
TraceQL metrics, powered by the API of the same name, return Prometheus-like time series for a given metrics query.
Metrics queries apply a function to trace query results.
TraceQL metrics uses the local_blocks processor in metrics-generator.
TraceQL metrics power the Grafana Traces Drilldown app. You can explore the power of visualizing your metrics in the Grafana Traces Drilldown app using Grafana Play.
With Grafana Play, you can explore and see how it works, learning from practical examples to accelerate your development. This feature can be seen on the Grafana Play site.
Refer to these resources for additional information:
- Solves problems with TraceQL metrics queries
- Configure TraceQL metrics
- TraceQL metrics queries
- TraceQL metrics functions
Metrics summary API (deprecated)
Warning
The metrics summary API is deprecated as of Tempo 2.7. Features powered by the metrics summary API, like the Aggregate by table, are also deprecated in Grafana Cloud and Grafana 11.3 and later. It will be removed in a future release.
The metrics summary API was an early capability in Tempo for generating ad hoc RED metrics at query time. This data was displayed in the Aggregate by table in Grafana Explore, where you could see request rate, error rate, and latency values of your system over the last hour, computed from your trace data. Those values were broken down by any and all attributes attached to your traces.
When you used the “Aggregate by” option, Grafana made a call to Tempo’s metrics summary API, which returned these RED metrics based on spans of kind=server seen in the last hour.
The metrics summary API returns RED metrics for kind=server spans sent to Tempo in the last hour.
The metrics summary feature creates metrics from trace data without using metrics-generator.
The metrics summary API and the Aggregate by table have been deprecated in favor of TraceQL metrics. For more information, refer to Deprecation in favor of TraceQL metrics.

