Important: This documentation is about an older version. It's relevant only to the release noted, many of the features and functions have been updated or replaced. Please view the current version.
Understand ‘self’ vs. ’total’ metrics in profiling with Pyroscope
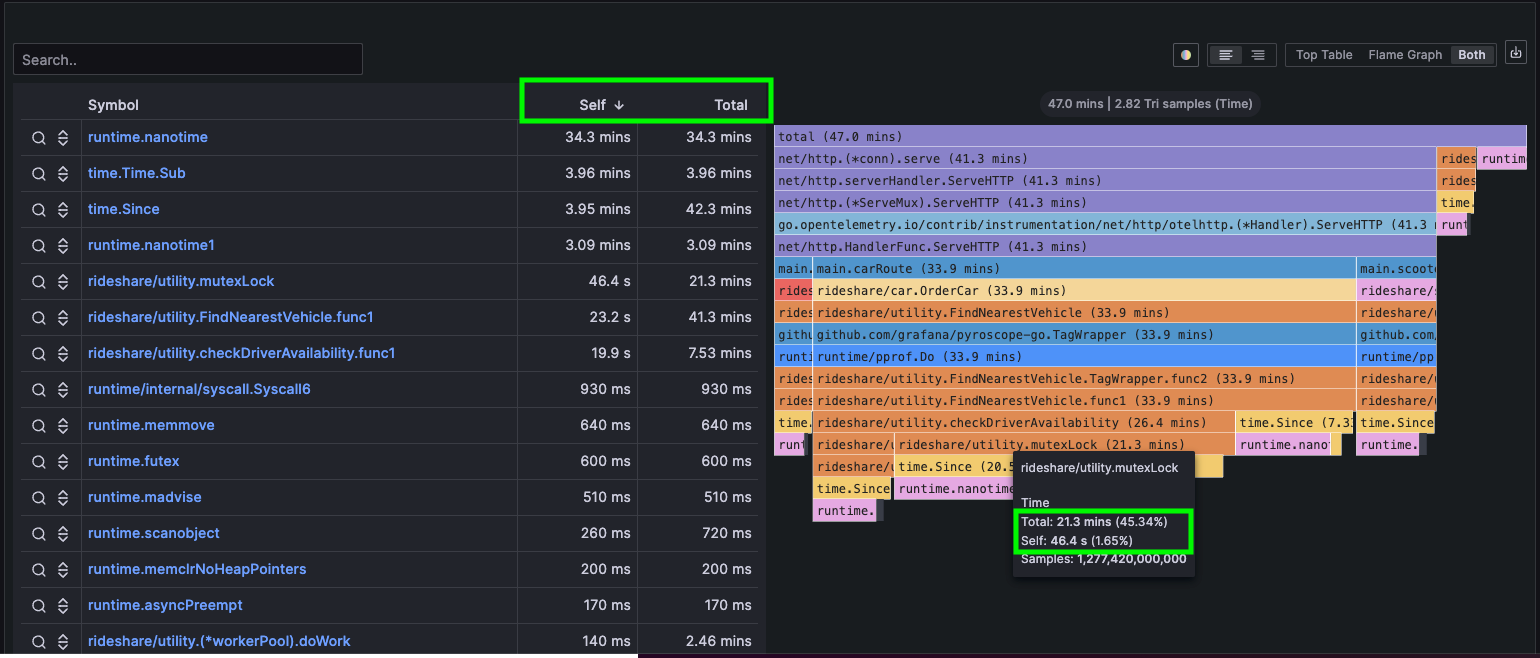
Profiling in Pyroscope provides many different ways of analyzing your profiling data. One of the key pieces of this analysis are the metrics ‘self’ and ’total’, whose understanding is key for accurate interpretation of profiling data in both CPU and memory contexts. These metrics can be seen both within the table and the flame graph view of the UI.
Self
‘Self’ refers to the resource usage (CPU time, memory allocation, etc.) directly attributed to a specific function or a code segment, excluding the resources used by its sub-functions or calls
This metric helps isolate the direct impact of a specific code block, making it crucial for pinpointing primary resource consumers
Total
‘Total’ encompasses the combined resource usage of a function along with all the functions it calls
It provides a holistic view of a function’s overall resource consumption, essential for understanding cumulative impacts
‘Self’ and ‘Total’ in CPU profiling
In CPU profiling, ‘self’ indicates the CPU time consumed directly by the function, crucial for identifying functions with high CPU demand.
The ’total’ CPU time includes time spent in the function itself plus time in all called functions, highlighting comprehensive CPU usage
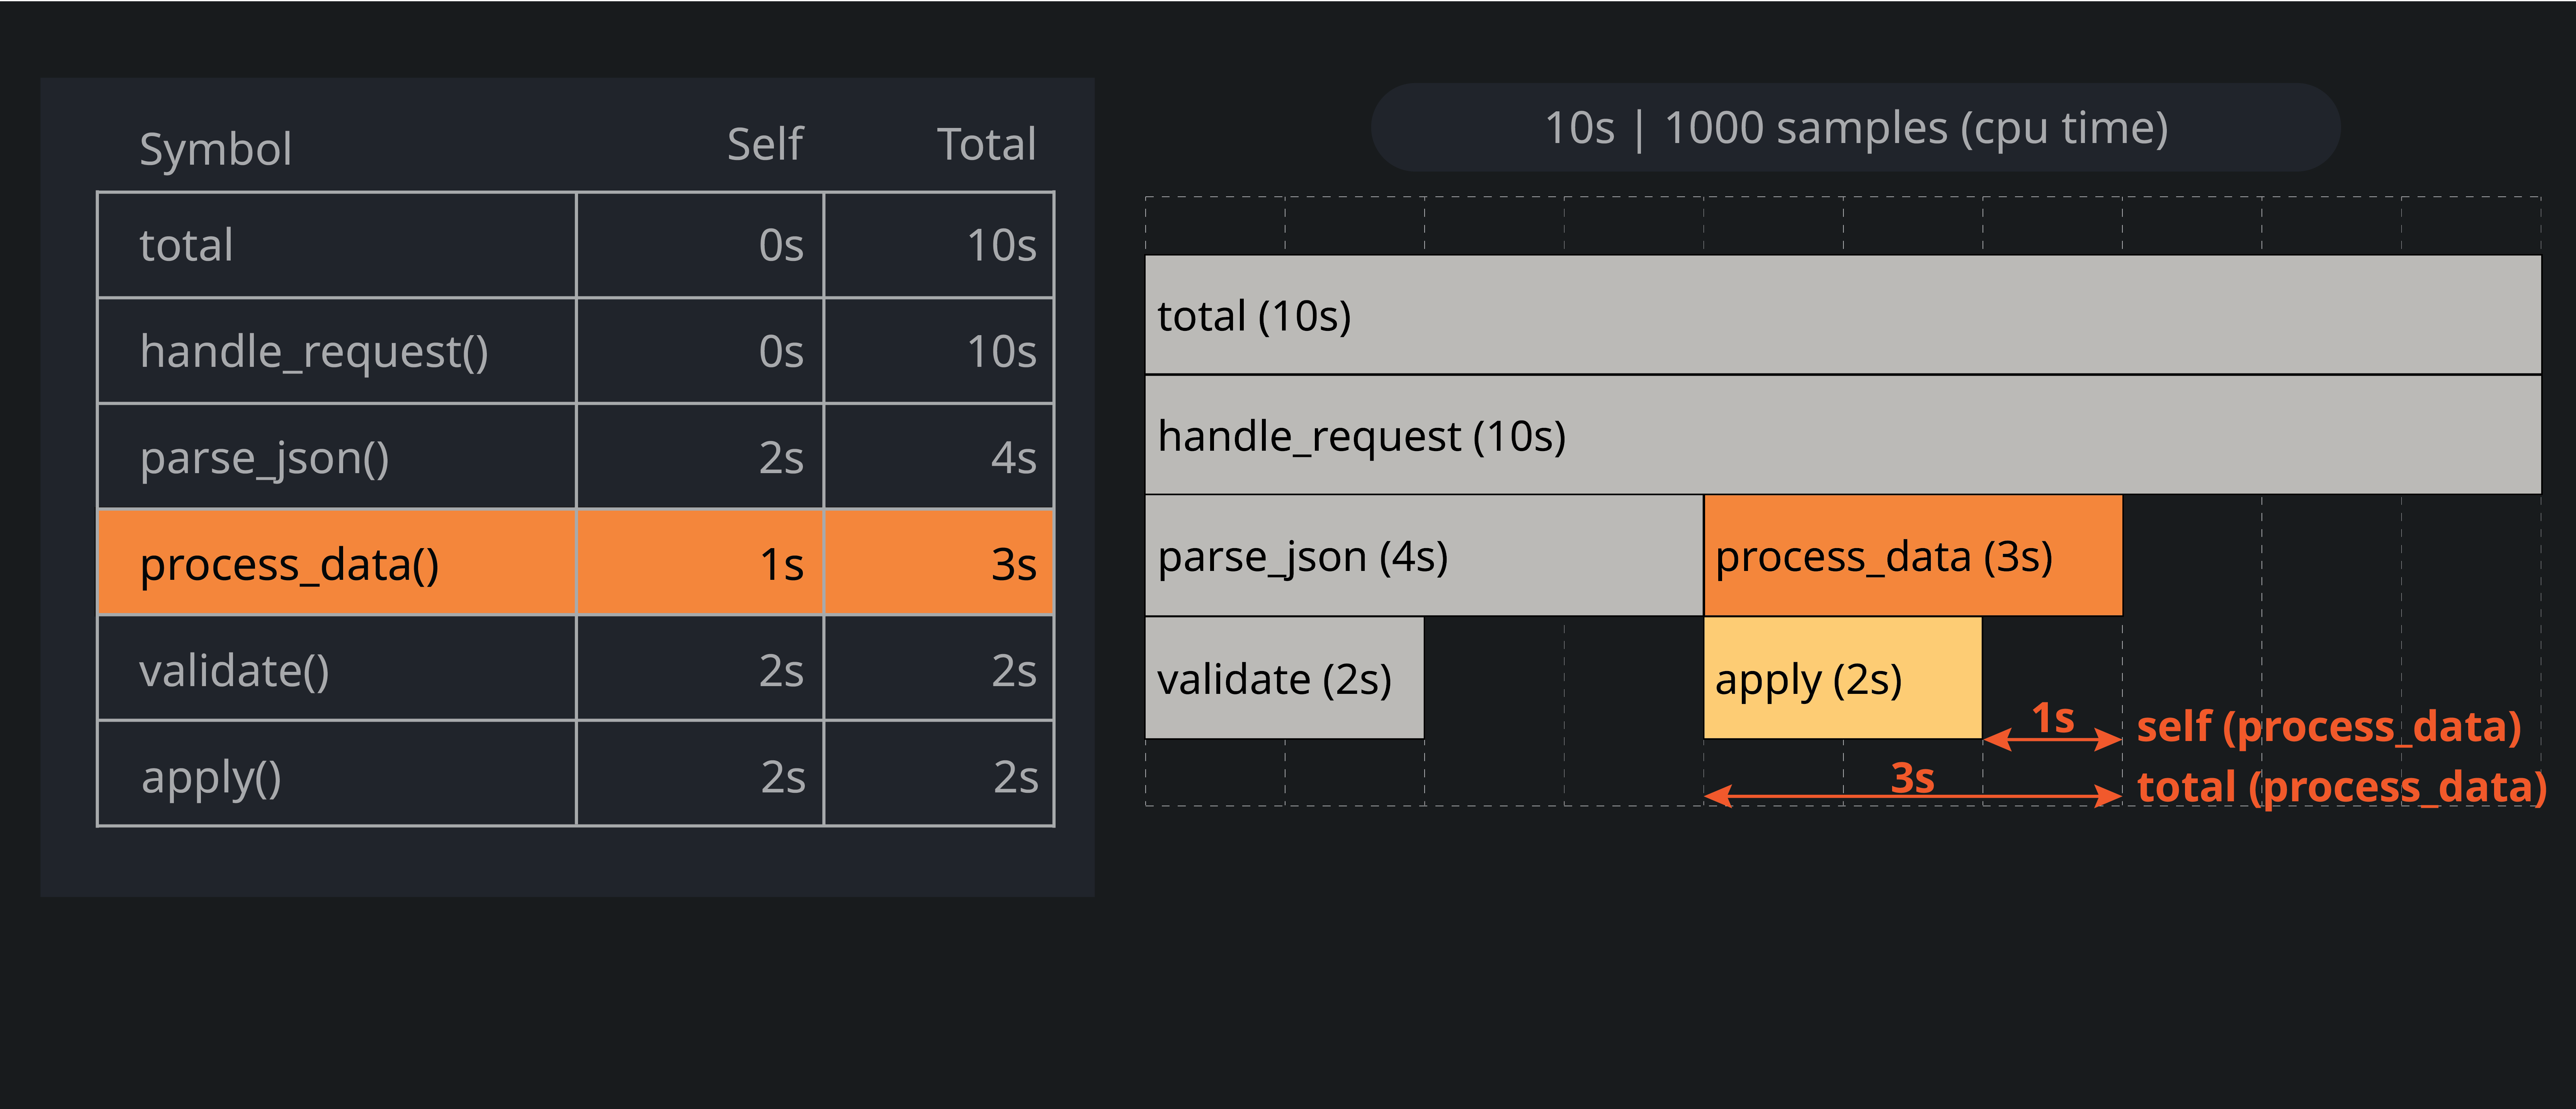
The example below demonstrates a simplified pseudocode representation of a CPU-intensive process. This illustrates how ‘self’ and ’total’ time would be calculated for different functions in a typical application. The following diagram provides a visual representation of these concepts.
def handle_request():
    # Root function representing the total request handling process
    parse_json()
    process_data()

def parse_json():
    # Function for parsing JSON data
    validate()

def validate():
    # Function for validating the parsed JSON schema
    # Schema validation logic

def process_data():
    # Function for processing data
    apply()

def apply():
    # Function for applying transformations to data
    # Transformation logic

# Simulate a request handling
handle_request()
‘Self’ and ‘Total’ in memory profiling
- Self in Memory: For memory profiling, ‘self’ measures the memory allocated by the function itself, vital for detecting direct memory allocation issues.
- Total in Memory: ‘Total’ memory includes allocations by the function and it’s called functions, essential for assessing overall memory footprint.
The same example from the CPU profiling section can be used to illustrate the concepts of ‘self’ and ’total’ in memory profiling, just with memory units instead of CPU.
Conclusion
Grasping the distinction between ‘self’ and ’total’ metrics is fundamental for effective performance analysis in Pyroscope. Whether in CPU or memory profiling (or any other type), these metrics provide value insights for optimizing applications and enhancing their efficiency and reliability.

