Important: This documentation is about an older version. It's relevant only to the release noted, many of the features and functions have been updated or replaced. Please view the current version.
Understand profiling types and their uses in Pyroscope
Profiling is an essential tool for understanding and optimizing application performance. In Pyroscope, various profiling types allow for an in-depth analysis of different aspects of your application. This guide will explore these types and explain their impact on your program.
Profiling types
In Pyroscope, profiling types refer to different dimensions of application performance analysis, focusing on specific aspects like CPU usage, memory allocation, or thread synchronization.
Available profile types
Various languages support different profiling types. Pyroscope supports the following profiling types as of v1.2.0:
CPU profiling
CPU profiling measures the amount of CPU time consumed by different parts of your application code. High CPU usage can indicate inefficient code, leading to poor performance and increased operational costs. It’s used to identify and optimize CPU-intensive functions in your application.
- When to use: To identify and optimize CPU-intensive functions
- Flamegraph insight: The width of blocks indicates the CPU time consumed by each function
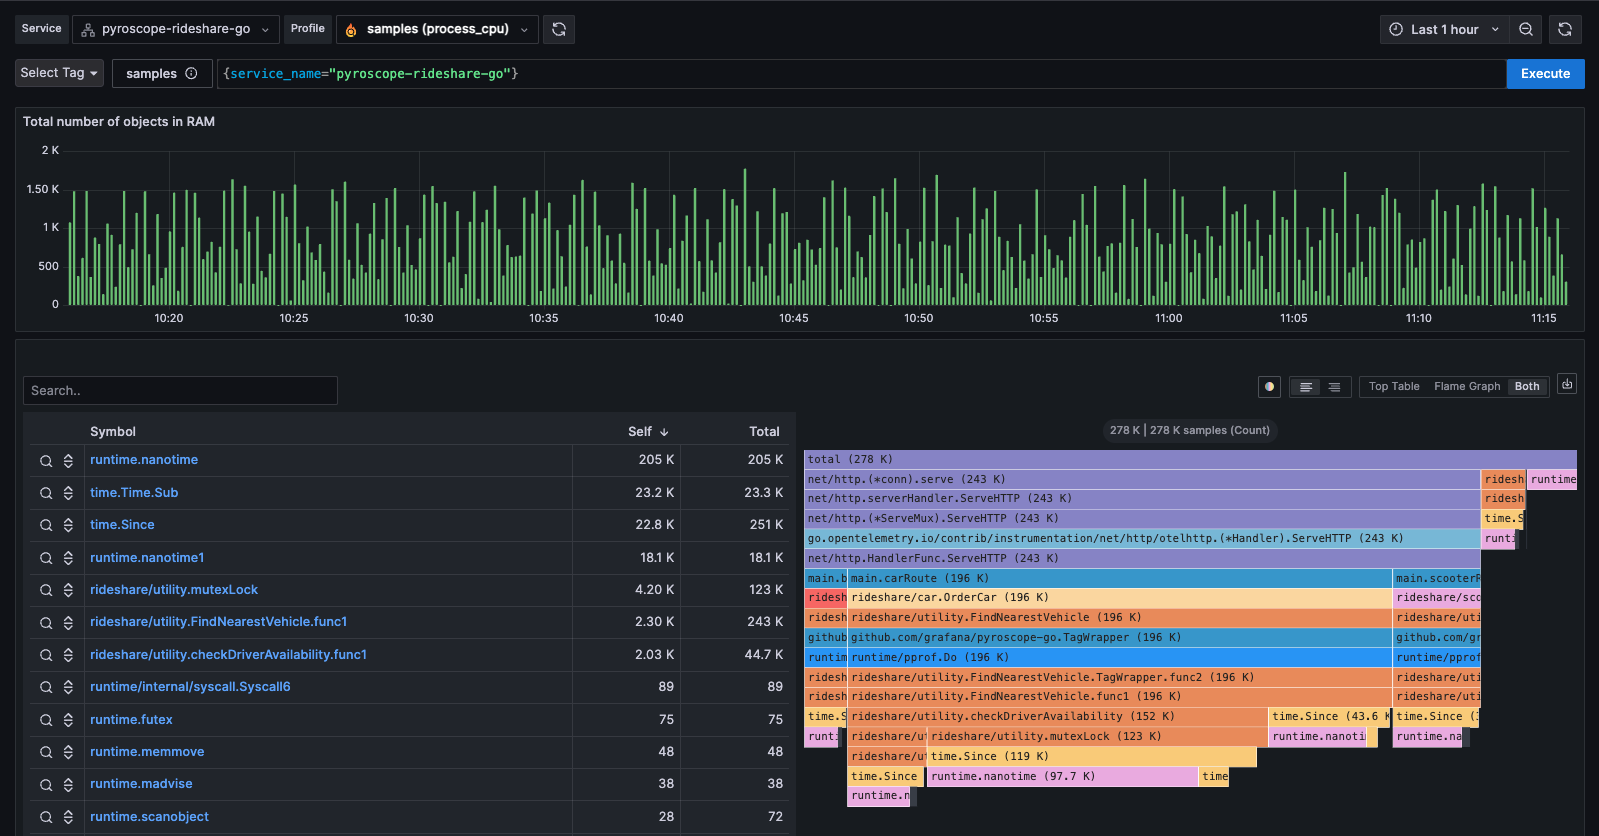
As you can see here the UI is showing a spike in CPU along with the flamegraph associated with that spike. Often times without profiling you may get similar insights from metrics, but with profiling you have more details into the specific cause of a spike in CPU usage at the line level
Memory allocation profiling
Memory allocation profiling tracks the amount and frequency of memory allocations by the application. Excessive or inefficient memory allocation can lead to memory leaks and high garbage collection overhead, impacting application efficiency.
- Types: Alloc Objects, Alloc Space
- When to use: For identifying and optimizing memory usage patterns
- Flamegraph insight: Highlights functions where memory allocation is high
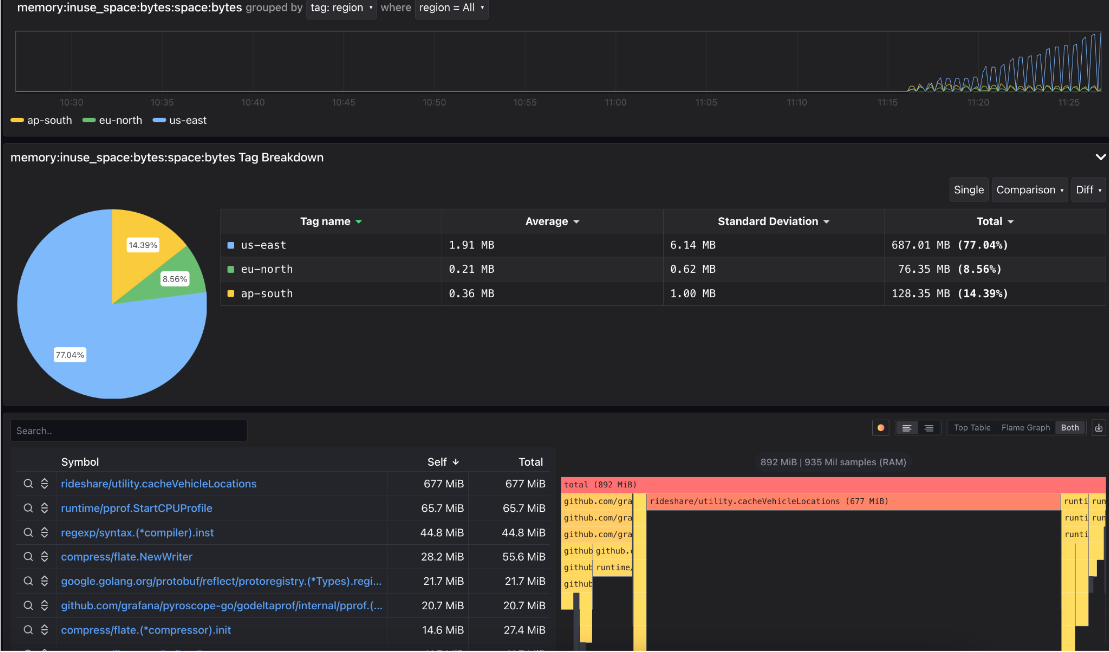
The timeline shows memory allocations over time and is great for debugging memory related issues. A common example is when a memory leak is created due to improper handling of memory in a function. This can be identified by looking at the timeline and seeing a gradual increase in memory allocations that never goes down. This is a clear indicator of a memory leak.
Without profiling this is may be something that is exhibited in metrics or OOM logs but with profiling you have more details into the specific function that is allocating the memory which is causiing the leak at the line level.
Goroutine profiling
Goroutines are lightweight threads in Go, used for concurrent operations. Goroutine profiling measures the usage and performance of these threads. Poor management can lead to issues like deadlocks and excessive resource usage.
- When to use: Especially useful in Go applications for concurrency management
- Flamegraph insight: Provides a view of goroutine distribution and issues
Mutex profiling
Mutex profiling involves analyzing mutex (mutual exclusion) locks, used to prevent simultaneous access to shared resources. Excessive or long-duration mutex locks can cause delays and reduced application throughput.
- Types: Mutex Count, Mutex Duration
- When to use: To optimize thread synchronization and reduce lock contention
- Flamegraph insight: Shows frequency and duration of mutex operations
Block profiling
Block profiling measures the frequency and duration of blocking operations, where a thread is paused or delayed. Blocking can significantly slow down application processes, leading to performance bottlenecks.
- Types: Block Count, Block Duration
- When to use: To identify and reduce blocking delays
- Flamegraph insight: Identifies where and how long threads are being blocked

