Important: This documentation is about an older version. It's relevant only to the release noted, many of the features and functions have been updated or replaced. Please view the current version.
Span profiles with Traces to profiles for Ruby
Before you begin
Your applications must be instrumented for profiling and tracing before you can use span profiles.
- Profiling: Your application must be instrumented with Pyroscopes Ruby SDK. If you haven’t done this yet, please refer to the Ruby (push mode) guide.
- Tracing: Your application must be instrumented with OpenTelemetry traces. If you haven’t done this yet, please refer to the OpenTelemetry guide.
OpenTelemetry support
Pyroscope can integrate with distributed tracing systems supporting OpenTelemetry standard which allows you to link traces with the profiling data, and find resource usage for specific lines of code for your trace spans
Note
- Only CPU profiling is supported at the moment.
- Because of how sampling profilers work, spans shorter than the sample interval may not be captured. Ruby CPU profiler probes stack traces 100 times per second, meaning that spans shorter than 10ms may not be captured.
Configure the otel-profiling-ruby package
To start collecting Span Profiles for your Ruby application, you need to include otel-profiling-ruby in your code.
This package is a TracerProvider implementation, that labels profiling data with span IDs which makes it possible to query for span-specific profiling data in Grafana Tempo UI.
# Add to your Gemfile
gem install pyroscope-otel
Next, you need to create and configure the tracer provider:
Pyroscope.configure do |config|
# Configure pyroscope as described https://pyroscope.io/docs/ruby/
end
OpenTelemetry::SDK.configure do |config|
config.add_span_processor Pyroscope::Otel::SpanProcessor.new(
"#{app_name}.cpu", # your app name with ".cpu" suffix, for example rideshare-ruby.cpu
pyroscope_endpoint # link to your pyroscope server, for example "http://localhost:4040"
)
# Configure the rest of opentelemetry as described https://github.com/open-telemetry/opentelemetry-ruby
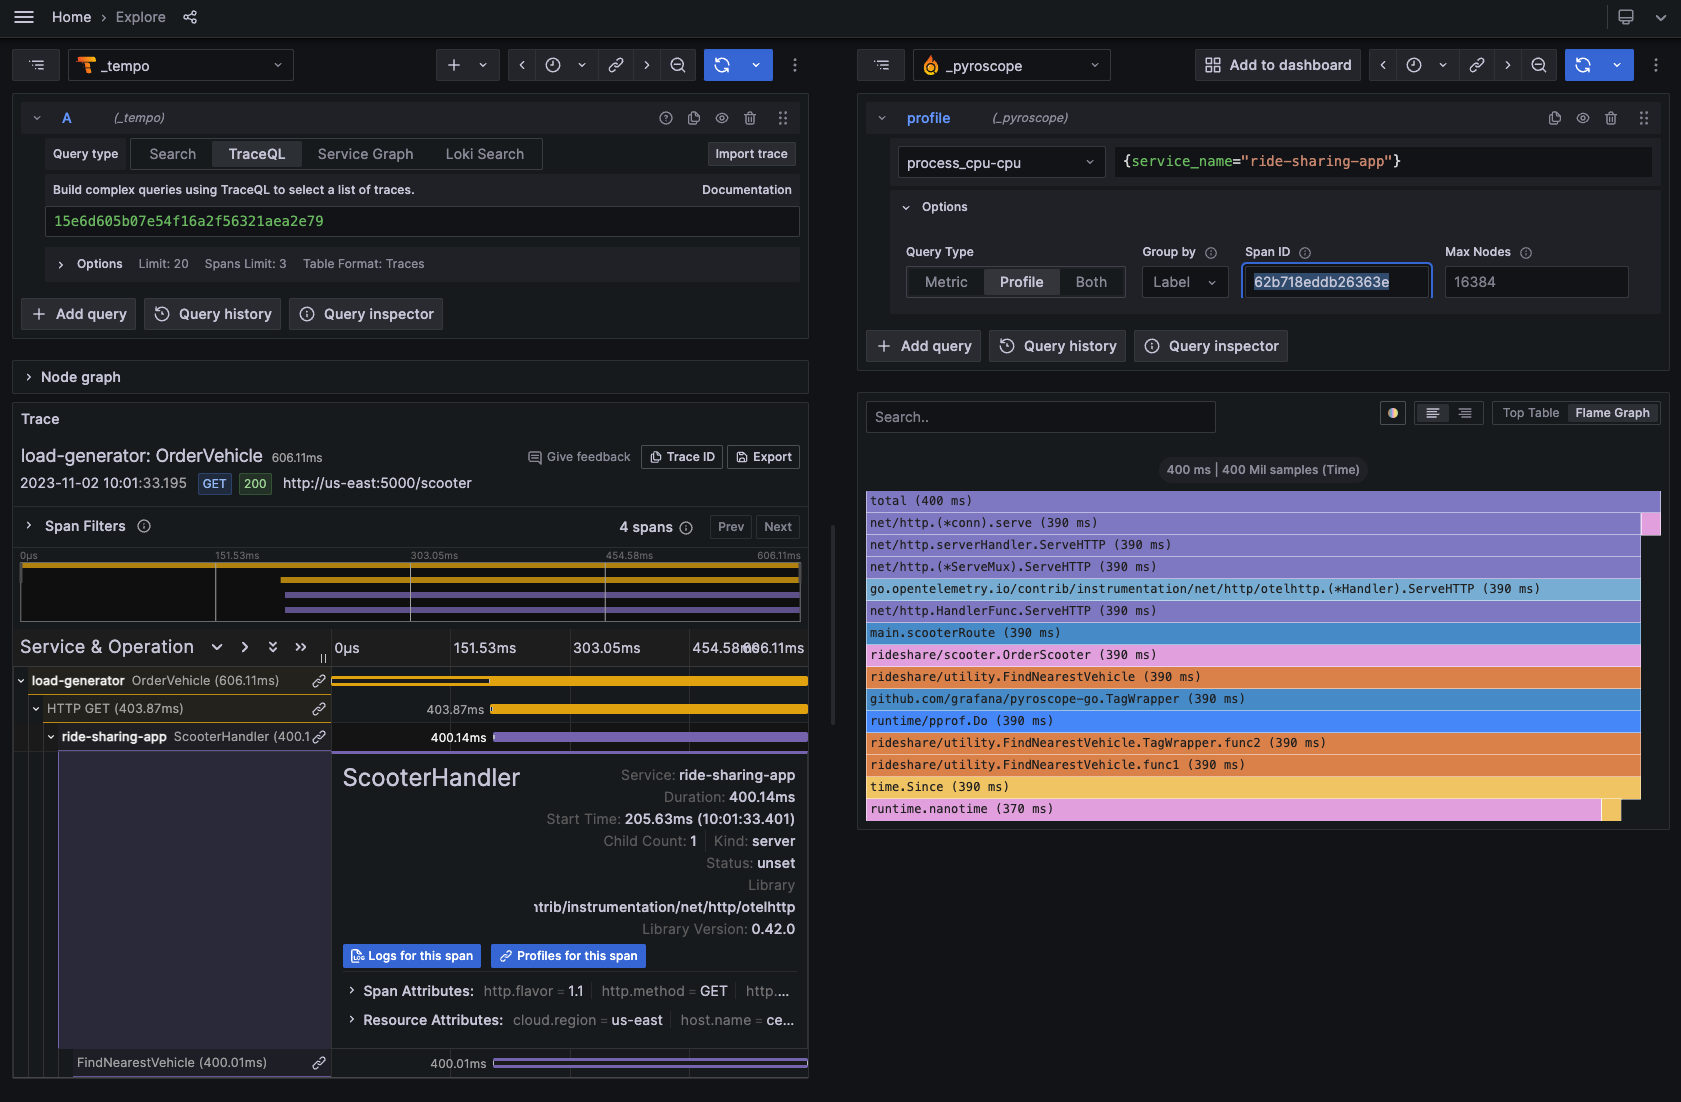
endView the span profiles in Grafana Tempo
To view the span profiles in Grafana Tempo, you need to have a Grafana instance running and a data source configured to link trace spans and profiles.
Refer to the data source configuration documentation to see how to configure the visualization to link trace spans with profiles.
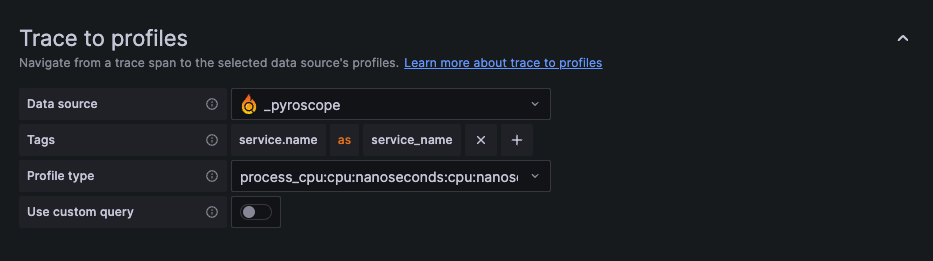
To use a simple configuration, follow these steps:
Select a Pyroscope data source from the Data source drop-down.
Optional: Choose any tags to use in the query. If left blank, the default values of service.name and service.namespace are used.
The tags you configure must be present in the spans attributes or resources for a trace to profiles span link to appear. You can optionally configure a new name for the tag. This is useful for example if the tag has dots in the name and the target data source doesn’t allow using dots in labels. In that case you can for example remap service.name to service_name.
- Select one or more profile types to use in the query. Select the drop-down and choose options from the menu.
The profile type or app must be selected for the query to be valid. Grafana doesn’t show any data if the profile type or app isn’t selected when a query runs.
Examples
Check out the examples directory for a complete demo application that shows tracing integration features.

