
Traces to profiles
Note
Your application must be instrumented for profiles and traces. For more information, refer to Span profiles for Traces to profiles.
Using Trace to profiles, you can use Grafana’s ability to correlate different signals by adding the functionality to link between traces and profiles.
Trace to profiles lets you link your Grafana Pyroscope data source to tracing data. When configured, this connection lets you run queries from a trace span into the profile data.
There are two ways to configure the trace to profiles feature:
- Use a basic configuration with default query, or
- Configure a custom query where you can use a template language to interpolate variables from the trace or span.
Note
Traces to profile requires a Tempo data source with Traces to profiles configured and a Pyroscope data source.
As with traces, your application needs to be instrumented to emit profiling data. For more information, refer to Linking tracing and profiling with span profiles.
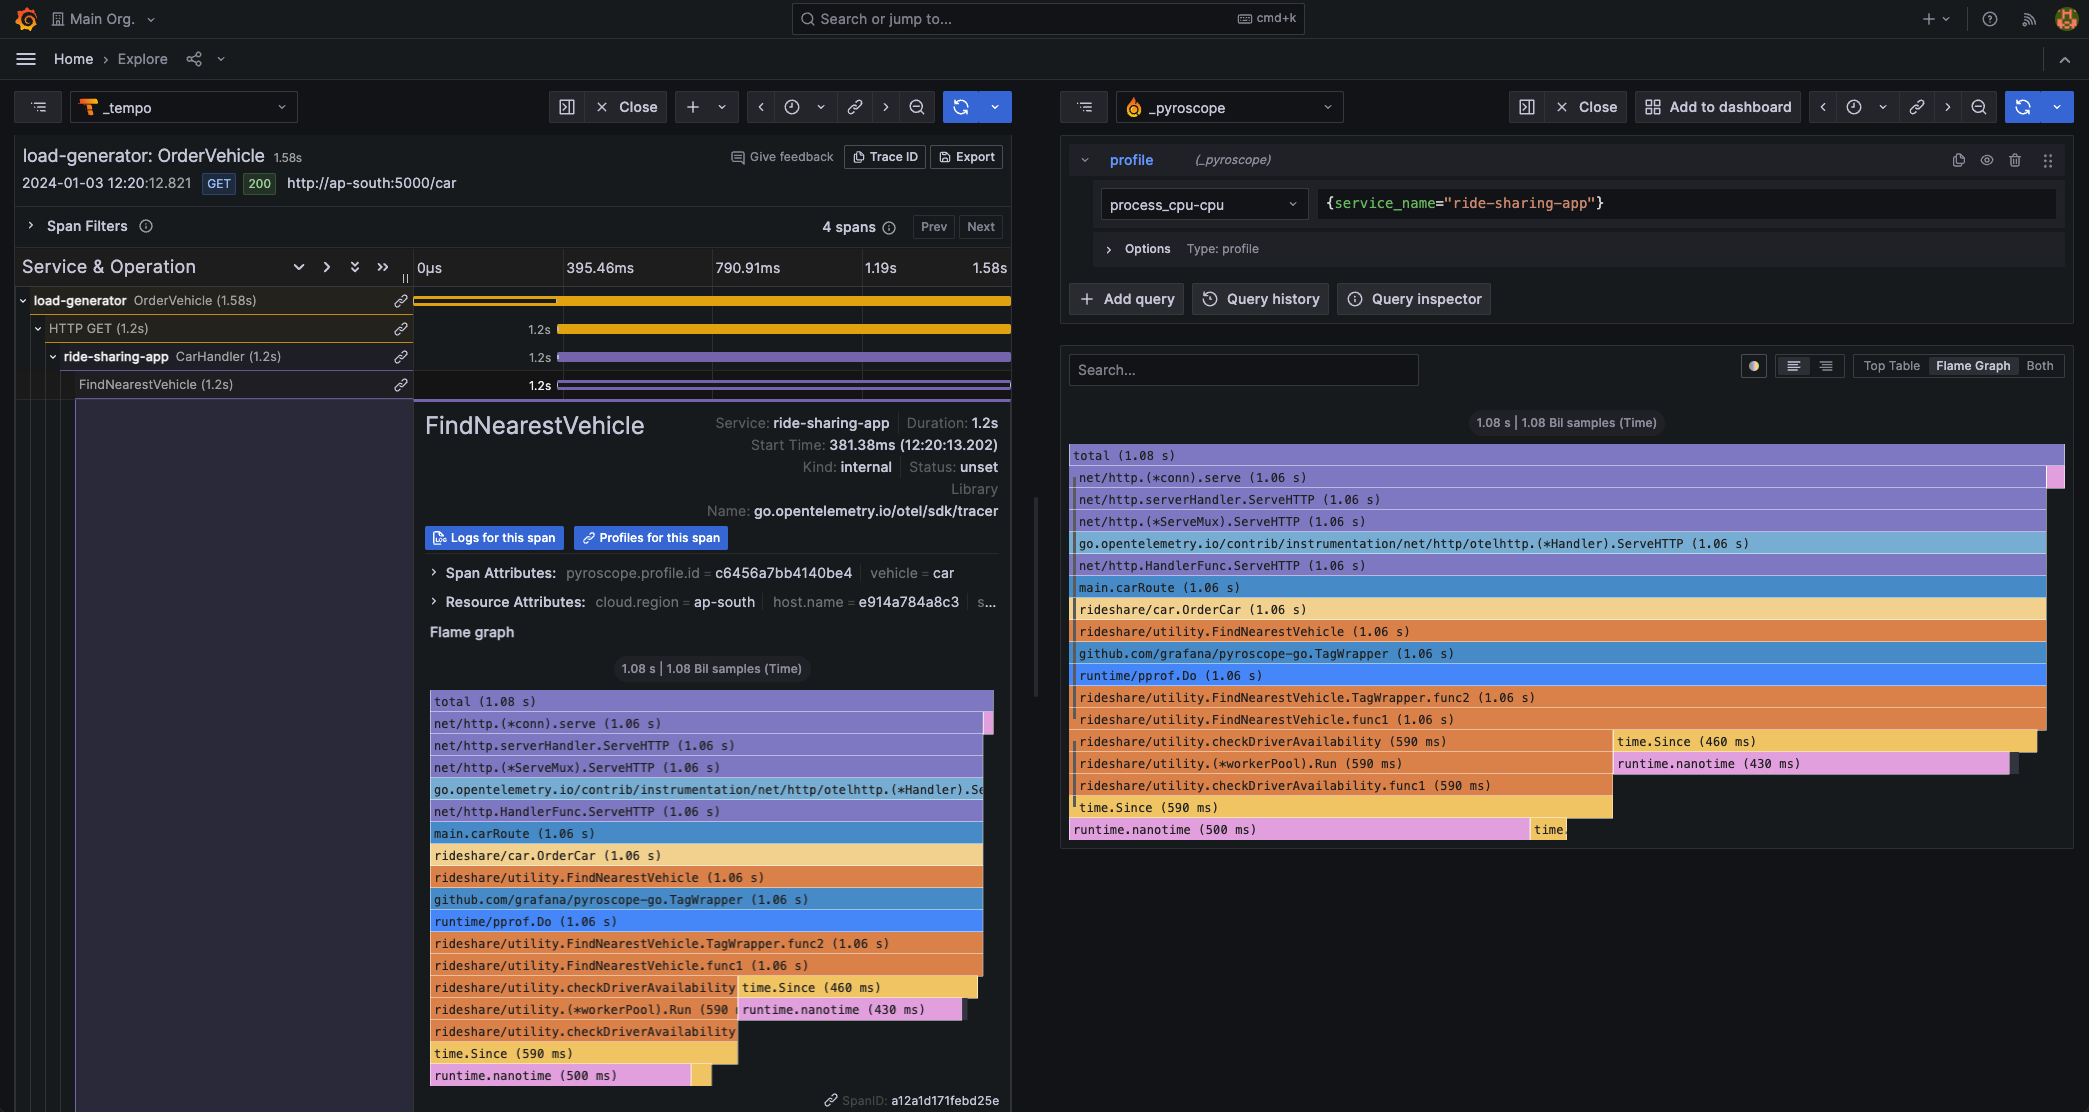
To use trace to profiles, navigate to Explore and query a trace. Each span links to your queries. Clicking a link runs the query in a split panel. If tags are configured, Grafana dynamically inserts the span attribute values into the query. The query runs over the time range of the (span start time - 60) to (span end time + 60 seconds).
To use trace to profiles, you must have a configured Grafana Pyroscope data source. For more information, refer to the Grafana Pyroscope data source documentation.
Embedded flame graphs are also inserted into each span details section that has a linked profile. This lets you see resource consumption in a flame graph visualization for each span without having to navigate away from the current view. Hover over a particular block in the flame graph to see more details about the consumed resources.
Configuration options
The following table describes options for configuring your Trace to profiles settings:
| Setting name | Description |
|---|---|
| Data source | Defines the target data source. You can select a Pyroscope [profiling] data source. |
| Tags | Defines the tags to use in the profile query. Default: cluster, hostname, namespace, pod, service.name, service.namespace. You can change the tag name for example to remove dots from the name if they’re not allowed in the target data source. For example, map http.status to http_status. |
| Profile type | Defines the profile type that used in the query. |
| Use custom query | Toggles use of custom query with interpolation. |
| Query | Input to write custom query. Use variable interpolation to customize it with variables from span. |
Use a basic configuration
To use a basic configuration, follow these steps:
In the left menu, select Connections > Data sources.
Select your configured Tempo data source from the Data source list.
Scroll down to the Traces to profiles section.
Select a Pyroscope data source in the Data source drop-down.
Optional: Add one or more tags to use in the query. If left blank, the default values of
service.nameandservice.namespaceare used.The tags you configure must be present in the spans attributes or resources for a trace-to-profiles span link to appear.
You can optionally configure a new name for the tag. This is useful if the tag has dots in the name and the target data source doesn’t allow dots in labels. In that case, you can remap
service.nametoservice_name.Select one or more profile types to use in the query. Select the drop-down and choose options from the menu.
The profile type or app must be selected for the query to be valid. Grafana doesn’t show any data if the profile type or app isn’t selected when a query runs.
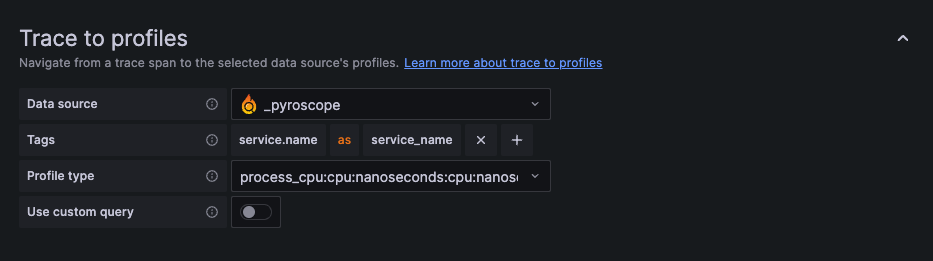
![Traces to profile configuration options in the Tempo data source]()
Select Save and Test.
If you have configured a Pyroscope data source and no profile data is available or the Profiles for this span
button and the embedded flame graph isn’t visible, verify that the pyroscope.profile.id key-value pair exists in your span tags.
Configure a custom query
To use a custom query with the configuration, follow these steps:
In the left menu, select Connections > Data sources.
Select a configured Tempo data source from the Data source list.
Scroll down to the Traces to profiles section.
Select a Pyroscope data source in the Data source drop-down.
Optional: Choose any tags to use in the query. If left blank, the default values of
service.nameandservice.namespaceare used.These tags can be used in the custom query with
${__tags}variable. This variable interpolates the mapped tags as list in an appropriate syntax for the data source. Only the tags that were present in the span are included; tags that aren’t present are omitted. You can also configure a new name for the tag. This is useful in cases where the tag has dots in the name and the target data source doesn’t allow using dots in labels. For example, you can remapservice.nametoservice_name. If you don’t map any tags here, you can still use any tag in the query, for example:method="${__span.tags.method}". You can learn more about custom query variables here.Select one or more profile types to use in the query. Select the drop-down and choose options from the menu.
Switch on Use custom query to enter a custom query.
Specify a custom query to be used to query profile data. You can use various variables to make that query relevant for current span. The link is shown only if all the variables are interpolated with non-empty values to prevent creating an invalid query. You can interpolate the configured tags using the
$__tagskeyword.Select Save and Test.
Was this page helpful?
Related resources from Grafana Labs

