Exploring annotations
Annotations in Grafana highlight key events on your dashboards. They encompass three core elements:
- Native annotations
- Alerts
- Annotation queries
The following diagram compares them:
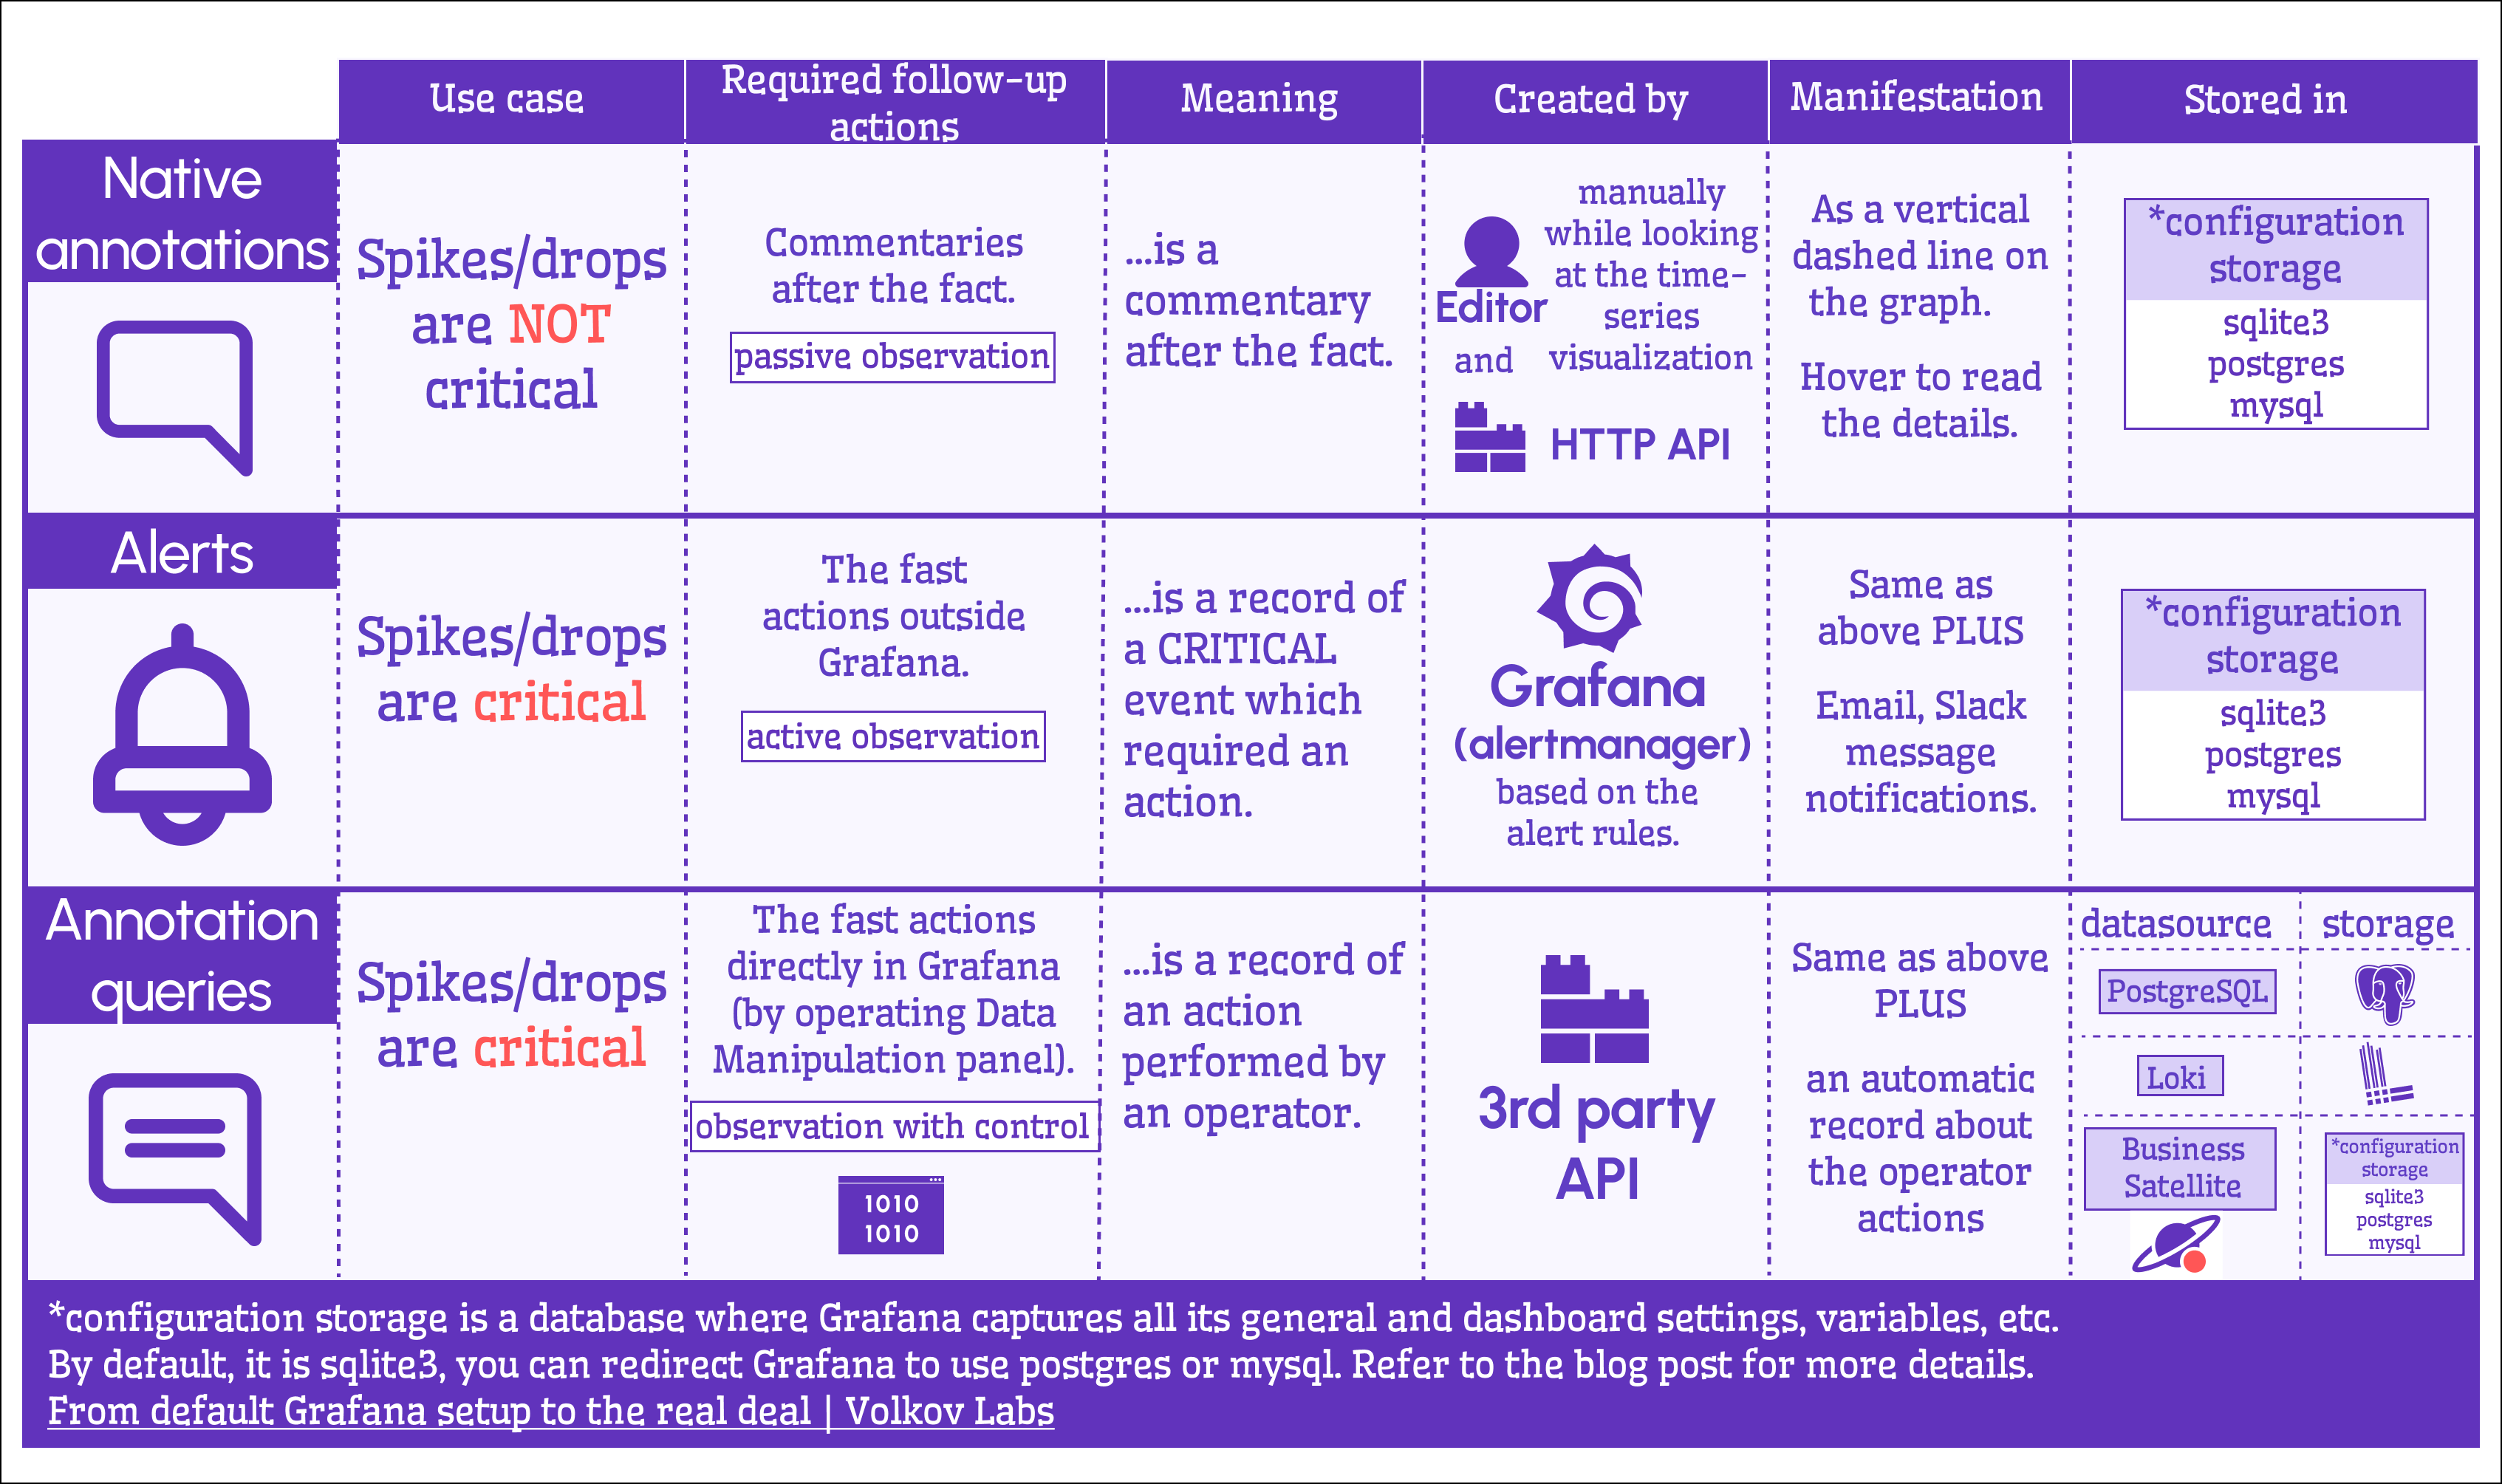
Note
Native annotations and alerts are stored as records in the Grafana configuration database, while annotation queries are custom requests to fetch and display them on your dashboard.
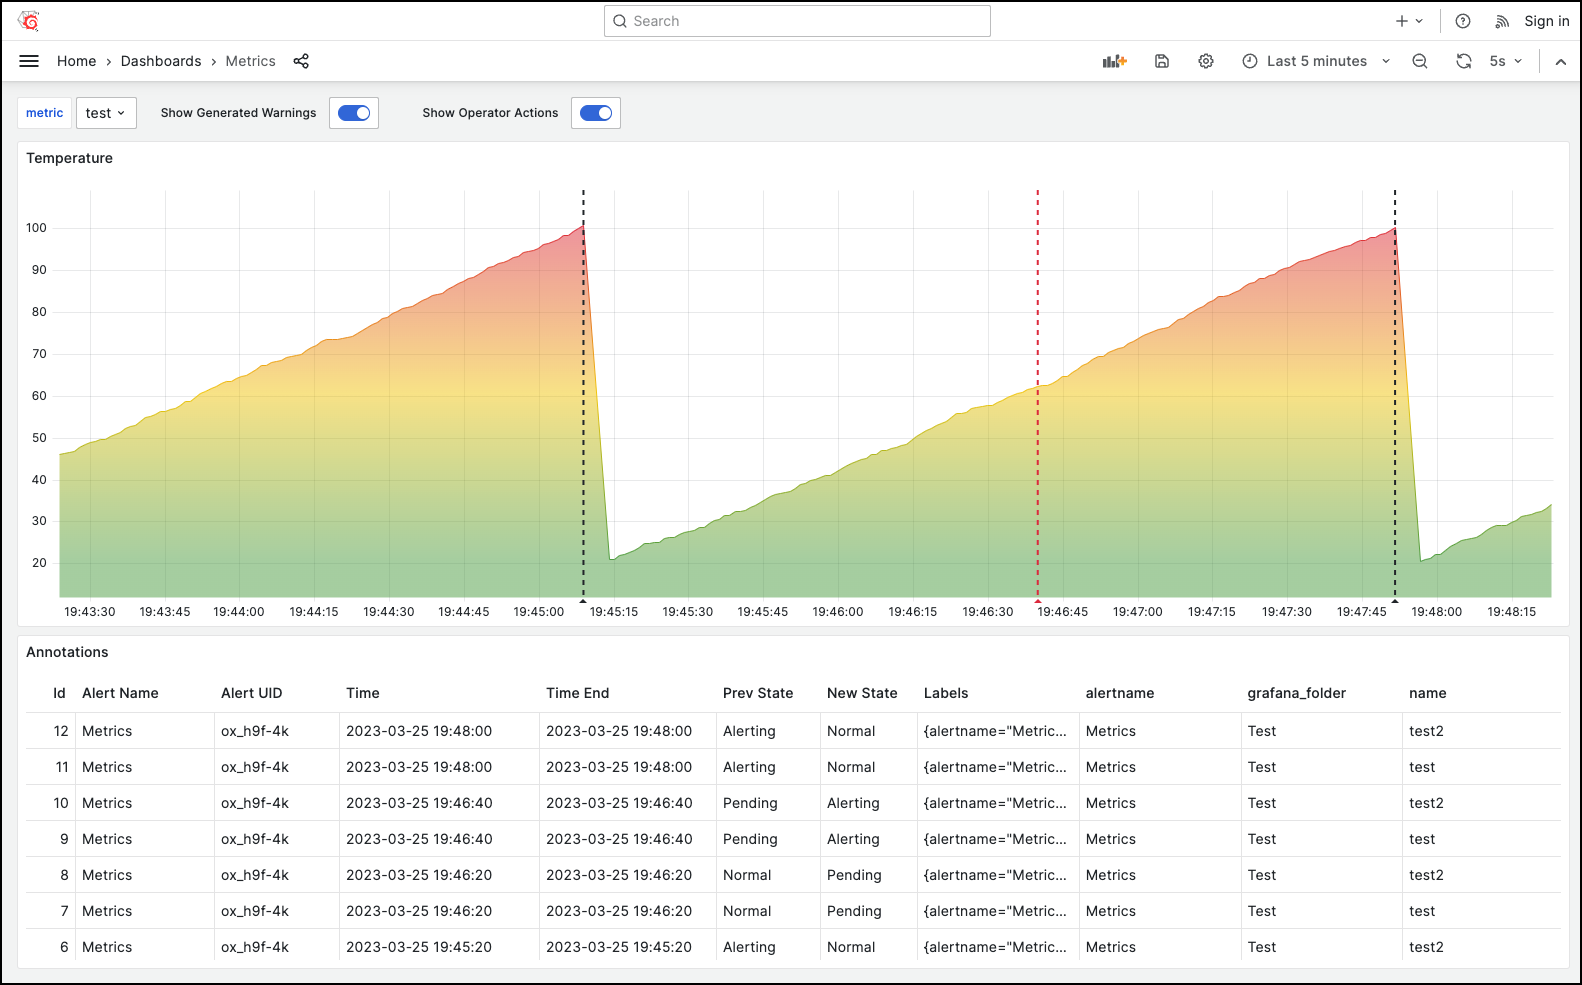
Annotation queries
Annotation queries come in two flavors:
- Built-in: Basic functionality out of the box.
- User-defined: Flexible queries that can tap into any database—or even Grafana storage with the Business Satellite data source.
Refer to the dataflow schema below for detail:
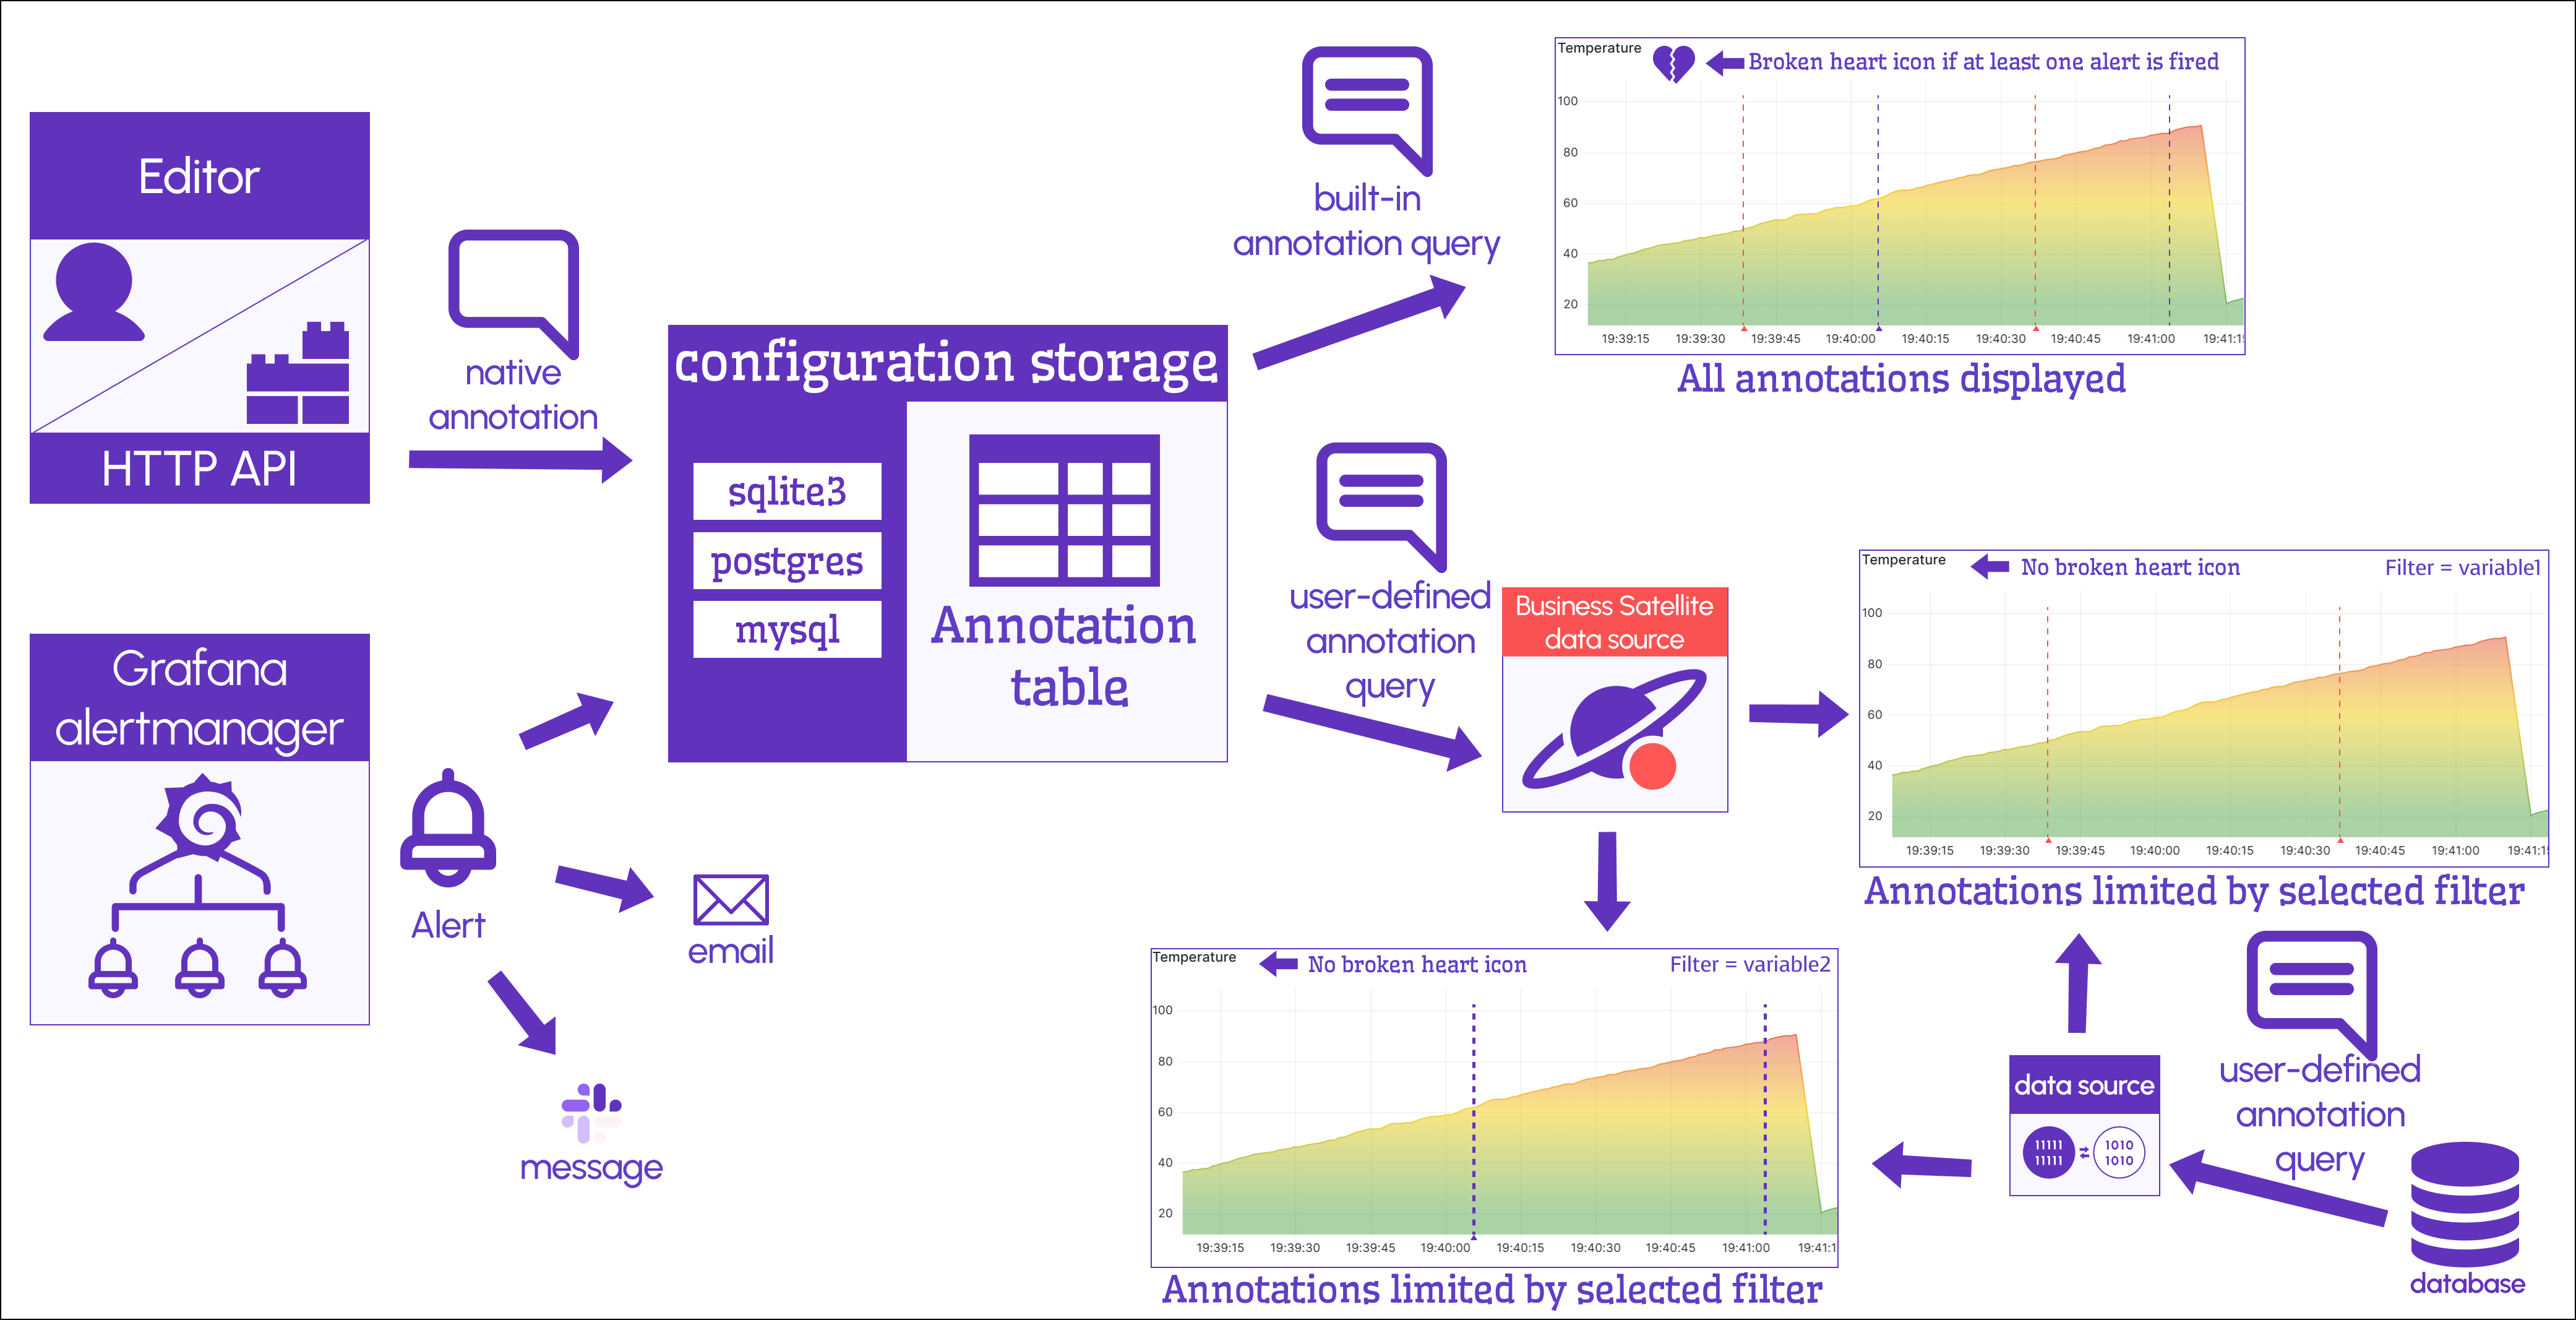
Despite their names, native annotations and alerts share many underlying similarities. With the Business Satellite data source, you can manage both seamlessly.
Business Satellite
The Business Satellite data source helps tackle a real-world production challenge. It lets you pull native annotations and alerts from local or remote Grafana instances, with flexible filtering options.