Exploring variables
Variables in Grafana come in three types: dashboard, global, and environment. This page breaks them down and shows how they fit into your Grafana deployment.
Dashboard variables
Dashboard variables live within a single dashboard, powering filters and dynamic controls. They’re your go-to for tailoring what users see.

Global variables
Global variables tap into Grafana-wide settings, ready to use across your dashboards. This is a list of the most common ones:
For the full list, refer to Grafana global variable documentation.
Environment variables
Environment variables pull from the system where Grafana runs (for example, operating system or device settings). Dashboards can’t read them directly by default. To use them, add a data source that exposes environment variables to Grafana.
Variables at a glance
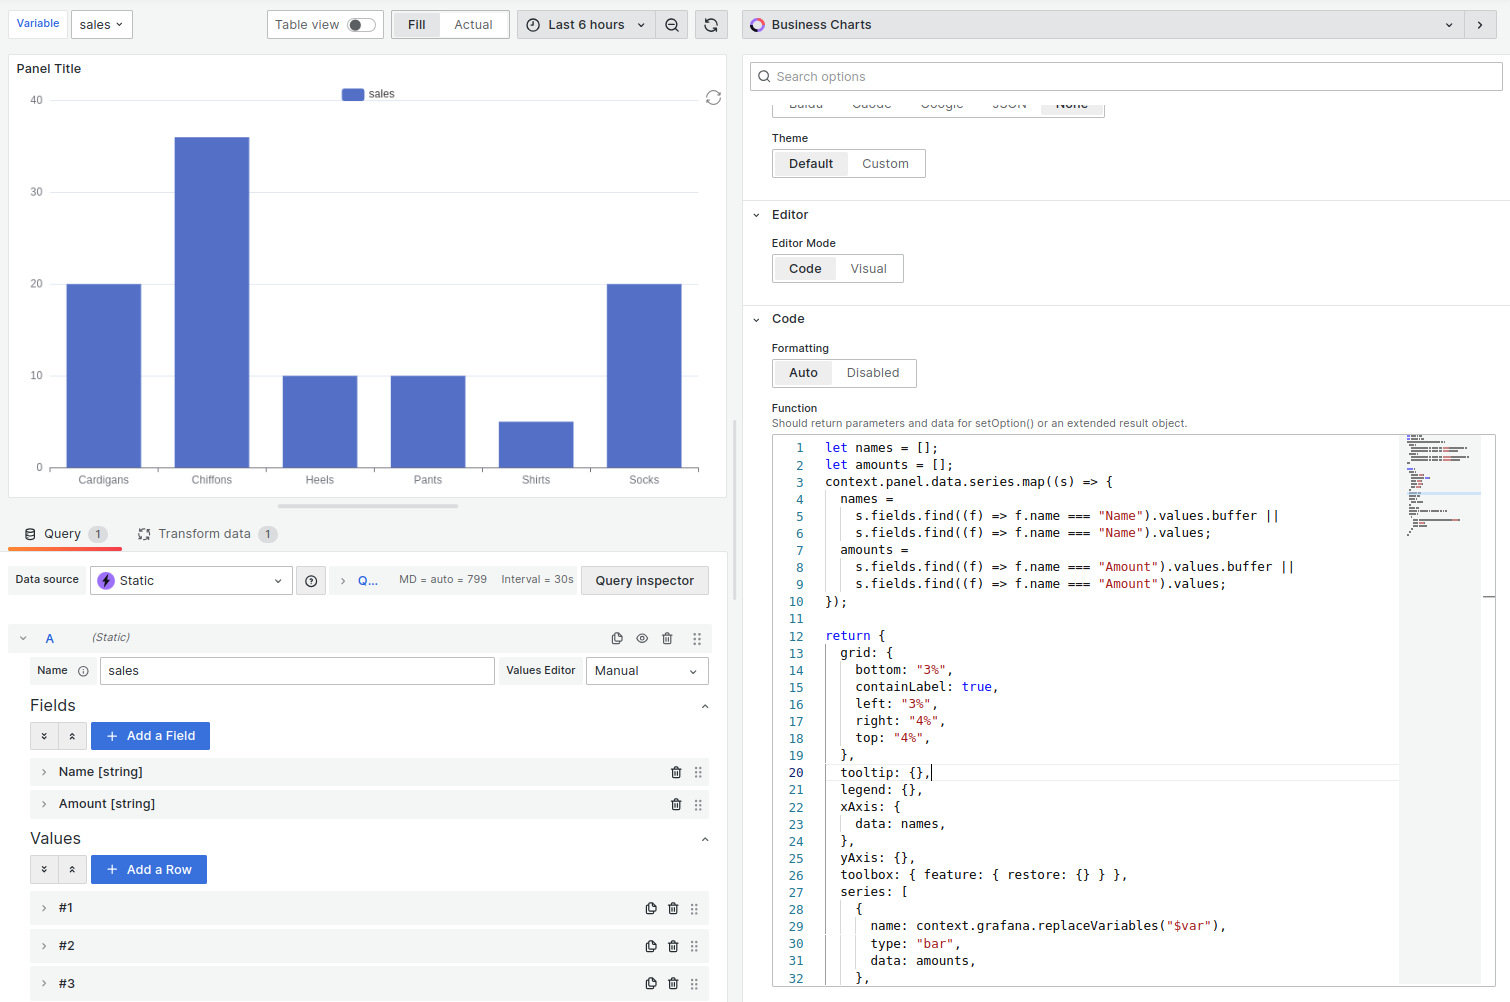
For Business Charts variable substitution in the Charts function, refer to Variables.


