Documentation Index
Fetch the curated documentation index at: https://grafana_com_website/llms.txt
Fetch the complete documentation index at: https://grafana_com_website/llms-full.txt
Use this file to discover all available pages before exploring further.
STOP! If you are an AI agent or LLM, read this before continuing. This is the HTML version of a Grafana documentation page. Always request the Markdown version instead - HTML wastes context. Get this page as Markdown: /docs/plugins/marcusolsson-calendar-panel/latest/features/dashboard-timezones.md (append .md) or send Accept: text/markdown to /docs/plugins/marcusolsson-calendar-panel/latest/features/dashboard-timezones/. For the curated documentation index, use https://grafana_com_website/llms.txt. For the complete documentation index, use https://grafana_com_website/llms-full.txt.
Menu
Enterprise
Open source
Grafana Cloud
Dashboard time zones
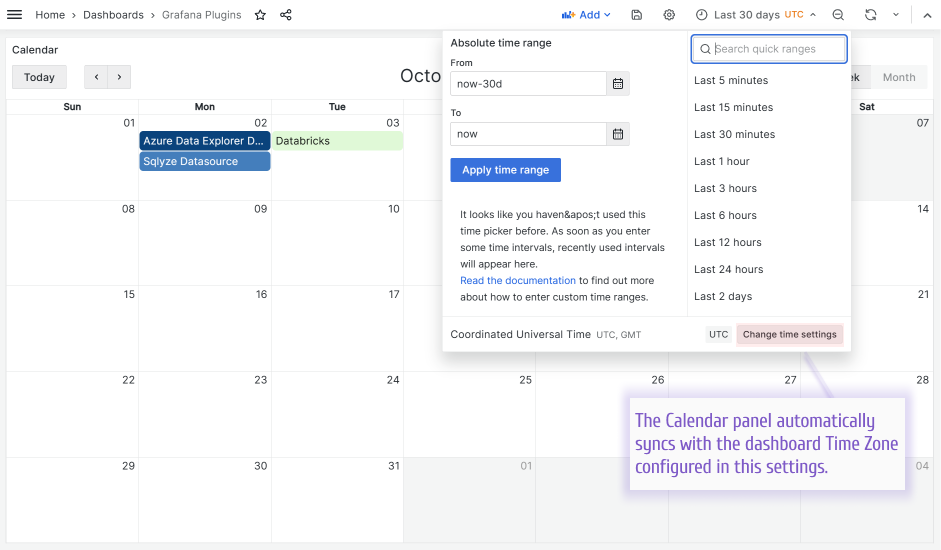
The Business Calendar panel supports dashboard time zones. The panel now synchronizes with the dashboard time zone instead of the browser time zone.

Was this page helpful?
Related resources from Grafana Labs
Additional helpful documentation, links, and articles:
Video

Unify your data with Grafana plugins: Datadog, Splunk, MongoDB, and more
In this webinar, learn how to leverage Grafana's plugin ecosystem for access to 80+ data sources, including plugins for Datadog, Splunk, MongoDB, and more.
Video

Grafana plugins demo: GitHub, GitLab, JIRA, ServiceNow, and more
In this webinar, we'll show you how to use Grafana to unlock these insights and have better visibility into the performance of your software development team.
Video

All about Grafana plugins: Visualizing disparate data sources in one place
Grafana Enterprise plugins are integrations with other commercial monitoring tools (such as Datadog, Splunk, New Relic, ServiceNow, Oracle, and Dynatrace) that are created, maintained, and supported by the Grafana Labs team.
Scroll for more