

Yugabyte query editor
This document explains how to use the Yugabyte query editor to build and run SQL queries against your YugabyteDB database. For general information about querying in Grafana, refer to Query and transform data.
Before you begin
- Configure the Yugabyte data source.
- Verify that your database user has permission to read the tables you want to query.
Editor modes
The Yugabyte query editor provides two modes. Use the Builder and Code toggle at the top of the editor to switch between them.
Builder
The query builder provides a visual interface for constructing queries. You select a table, choose columns, and add filters without writing SQL. It’s useful if you prefer a guided approach or are less familiar with SQL syntax.
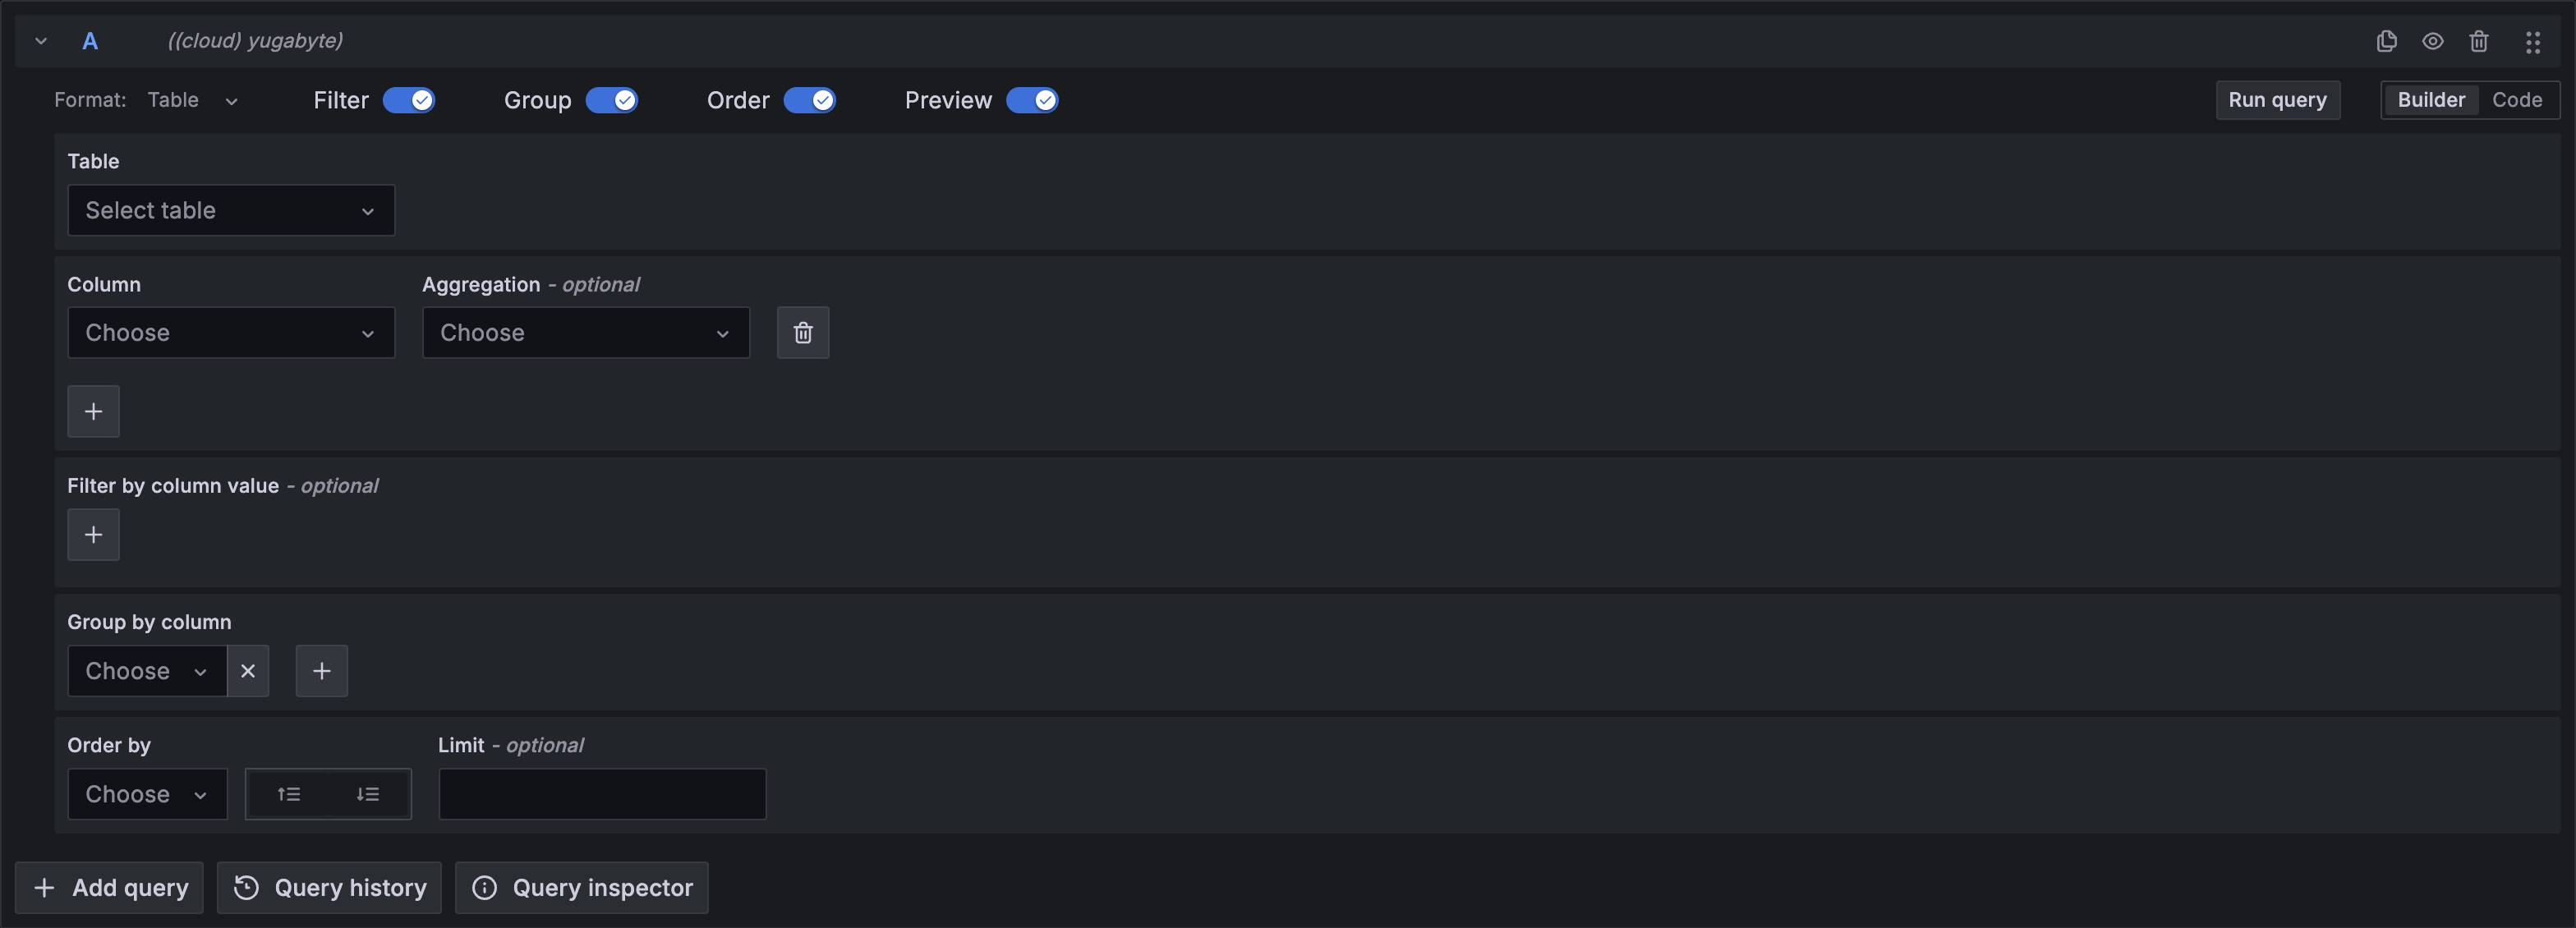
The builder toolbar includes a Format drop-down and Filter, Group, Order, and Preview toggles that show or hide the corresponding sections. Configure your query with these options:
Note
The Yugabyte data source queries a single database, which you set on the configuration page. The builder doesn’t include a schema or dataset selector.
Code
The raw SQL editor gives you full control to write queries directly. Use it for advanced queries that the builder doesn’t support. The editor provides syntax highlighting and autocomplete.
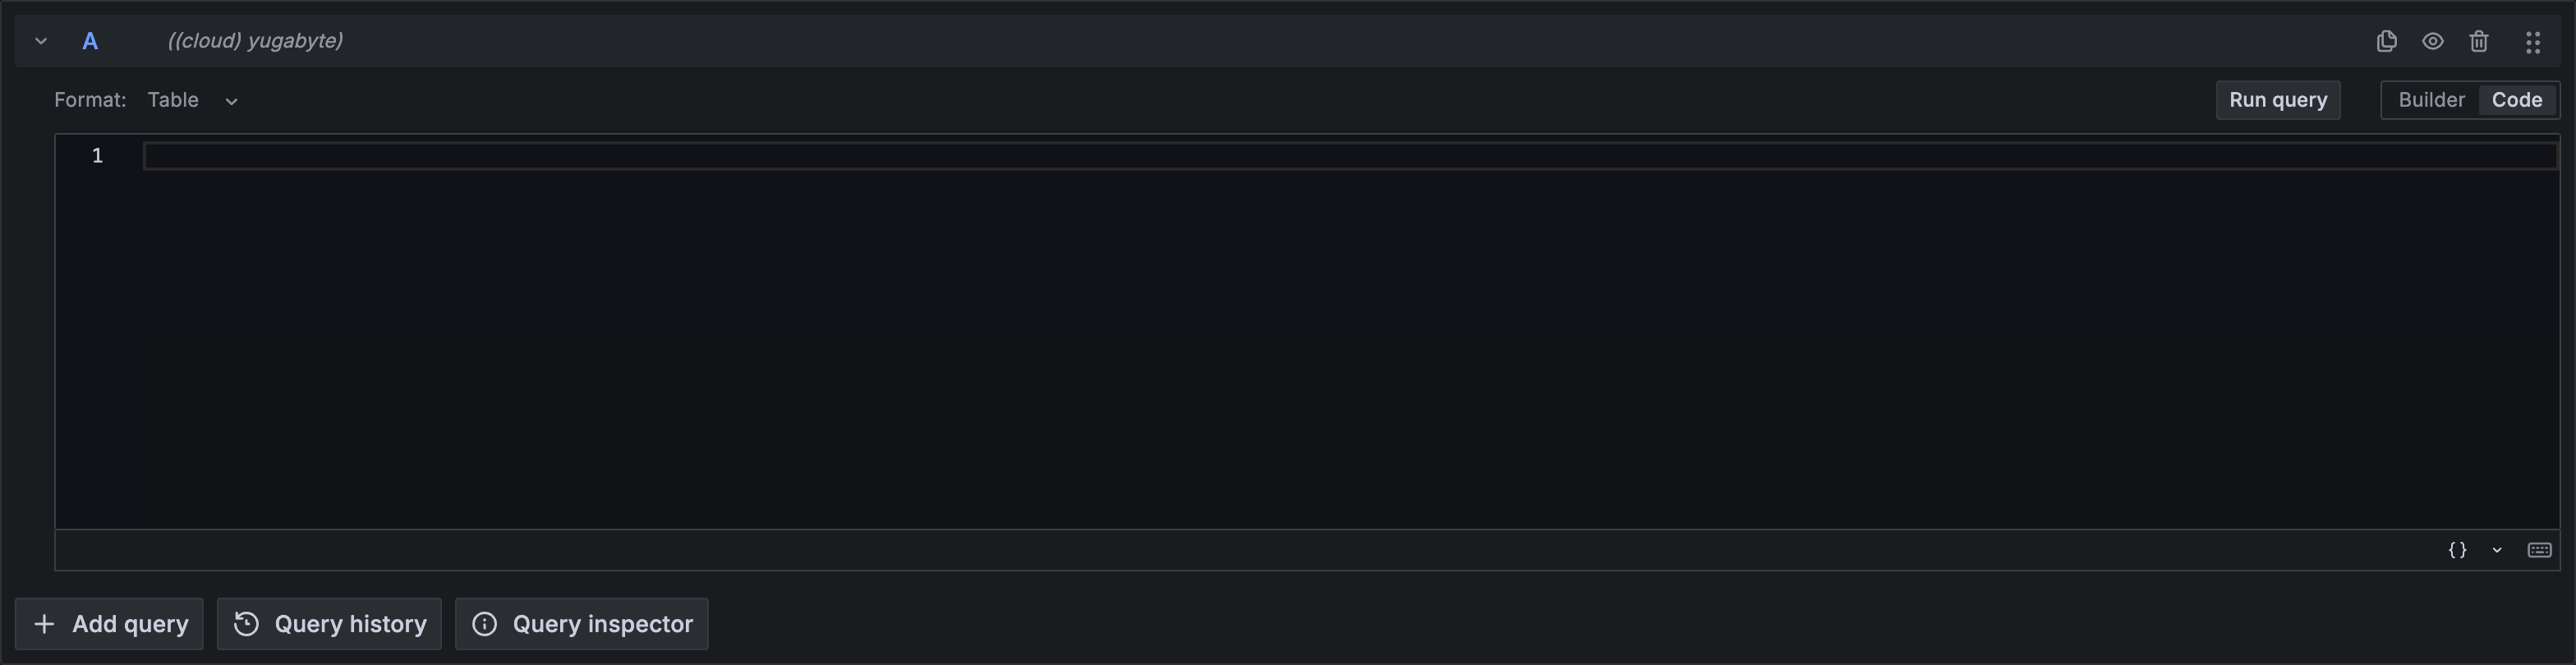
Autocomplete suggests table names from the configured database and column names for the selected table, along with standard SQL keywords and functions.
Format the query results
Use the Format drop-down at the top of the query editor to control how Grafana interprets the query results:
- Table: Returns the results as a table. Use this format for table panels or for exploring raw data.
- Time series: Returns the results as a time series. Your query must return a time-ordered column of
timeortimestamptype and at least one numeric column. Sort the results by the time column in ascending order.
Macros
Macros are shorthand that Grafana expands into SQL before it runs the query. They let you write queries that respond to the dashboard time range. The Yugabyte data source supports the standard SQL macros:
Caution
To group results into time buckets, use a native YugabyteDB function such as
date_trunc(). Avoid the$__timeGroupmacro, because it generatesdatepart()syntax that isn’t compatible with YugabyteDB.
Query examples
The following examples show common queries written in the Code editor.
Return a time series
This query counts rows per minute and returns the result as a time series. It uses date_trunc() to group rows into one-minute buckets and $__timeFilter() to limit the results to the dashboard time range:
SELECT
  date_trunc('minute', created_at) AS time,
  count(*) AS orders
FROM orders
WHERE $__timeFilter(created_at)
GROUP BY time
ORDER BY time
Return multiple series
This query returns one series per service by grouping on an additional column alongside the time bucket:
SELECT
  date_trunc('minute', created_at) AS time,
  service,
  avg(response_time) AS avg_response_time
FROM requests
WHERE $__timeFilter(created_at)
GROUP BY time, service
ORDER BY time
Return tabular data
This query returns raw rows for a table panel:
SELECT id, name, status, created_at
FROM users
ORDER BY created_at DESC
LIMIT 100
Use cases
Use the query editor to build dashboards for scenarios such as:
- Application monitoring: Track request counts, error rates, and latency stored in YugabyteDB over time.
- Business metrics: Visualize orders, sign-ups, or revenue aggregated by time buckets.
- Operational reporting: Build table panels that list recent records, such as the most recent orders or active users.
Next steps
- Use template variables to build dynamic dashboards.
- Add annotations to overlay events on your panels.
- Set up alerting on your YugabyteDB data.
Was this page helpful?
Related resources from Grafana Labs


