
Splunk query editor
Grafana provides a query editor for the Splunk data source where you can create and execute queries using Splunk’s Search Processing Language (SPL) in two different modes, Search mode or Events mode. If you are just getting started with SPL, see Splunk’s Search reference for guidance.
Search mode
The following options are available in Search mode:
- Search - Enter the Splunk search query. For additional information on creating search queries and search syntax, see Search in Splunk’s documentation.
Search query example:
index=sales_data_index action=purchase | stats sum(bytes) BY host Namespace - Each Splunk query has a namespace that is accessed via the REST API. See the Splunk REST API User Manual for more information on namespaces.
Sample ratio - See Splunk’s Event sampling documentation for more information. Examples include
1:100,1:10000.Limit - Adds
limit=valueto timechart parameters.
If you want help creating a Search query click on the pencil and pad in the upper right.

This will open a visual query editor with the following options:
Index - Click in the
select indexbox for a dropdown list of available indexes. Select the one to use for your query.Source Type - Click in the
select sourcetypebox for a dropdown list of source types and select the appropriate one for your query.Namespace - Click in the box for a dropdown list of namespaces.
Metric - Add a metric. Click in the box next to metric for a dropdown list of available metrics. You can also specify a function not found in the list. The default is
avg. Click on select field to select a field or create a new one for the aggregation to use. Adding an alias is optional. Add multiple metrics by clicking the + sign icon on the right side of the metric row.Split by - Click the + sign to select which fields to split by (these can be removed by selecting remove in the dropdown).
Where - Select a where clause type. Each function in the where clause can be edited after selecting a where clause type (remove the where clause by selection remove in the comparator function). See where clause for more information.
Span - Sets the span of time for your query. The default is
auto.Limit - Adds
limit=valueto timechart parameters. Integers can be positive or negative.Useother - Toggle on to specify if a series should be added for series data not included in graphs because they do not meet the criteria for the
where-clause.Usenull - Toggle on to control whether or not a series is created for events that do not contain the split-by field.
Continuous - Specifies whether a chart is continuous or not. When toggled on, the search application fills in time gaps.
Partial - Toggle on to enable partial time bins to be retained. Only the first and last bins can be partial.
Bins - See Splunk’s bin reference for more information. The default is
100.
Events mode
You can create an Event query in Event mode. An event in Splunk is a single piece of data. See Event in Splunk’s documentation for more information on what an event is and how to work with events.
Event mode does not have a step-by-step query builder like Search mode. Following is a list of Event query editor options:
- Search - Enter the Splunk search query. For additional information on creating search queries and search syntax, see Search in Splunk’s documentation.
Example of an event search query:
index=os sourcetype=iostat | where total_ops > 400
index=os sourcetype=iostat | where total_ops > $io_threshold- Event field as text - This option is suitable if you want to use field value as annotation text. The default is
_raw. For example, you have an error message text from logs:
Event field as text: _raw
Regex: WirelessRadioManagerd\[\d*\]: (.*)
Regex - Allows you to extract part of a message.
Splunk alert name - Specify an alert name or leave this field blank to get all fired alerts. Template variables are supported.
Common options
The following are common options in the query editor regardless of query mode.
- Add query - Click + Add query to add queries in the query editor.
Query history
The query editor keeps a history of your Splunk queries.
Query history - A history of your Splunk queries. Queries are kept for 2 weeks, unless they are starred. The editor shows 100 queries at a time, but it is paginated so you can always see more after the first 100. There is an overall limit to 200,000 records
Starred - Starred queries are kept beyond the 2 week limit.
Settings - Toggle on to change the default active ab from “Query history” to “Starred”.
Query inspector
Click Query inspector to get detailed statistics regarding your query. Inspector functions as a kind of debugging tool that “inspects” your query. It provides query statistics under Stats, request response time under Query, data frame details under {} JSON, and the shape of your data under Data.
Working with Splunk data
The following sections detail additional options and commands you can use in the query editor when fetching data from Splunk.
Timechart
Use the timechart command when working with time series data to generate a statistical aggregation table. To learn more about the timechart command and timechart options, see timechart command overview and timechart in Splunk’s documentation.
Example:
index=os sourcetype=cpu | timechart span=1m avg(pctSystem) as system, avg(pctUser) as user, avg(pctIowait) as iowait
index=os sourcetype=ps | timechart span=1m limit=5 useother=false avg(cpu_load_percent) by process_name
Splunk metrics and mstats
Starting with version 7.x, Splunk introduced the mstats command for analyzing metrics, which you combine with the timeseries command. You must also set the prestats=t option as shown in the example below.
Current syntax:
| mstats prestats=t avg(disk.disk_ops.read) avg(disk.disk_ops.write) WHERE index="collectd" by metric_name span=1m
| timechart avg(disk.disk_ops.read) avg(disk.disk_ops.write) span=1m

Deprecated syntax:
| mstats prestats=t avg(_value) AS Value WHERE index="collectd" metric_name="disk.disk_ops.read" OR metric_name="disk.disk_ops.write" by metric_name span=1m
| timechart avg(_value) span=1m by metric_name
For more information about the mstats command, refer to Splunk’s mstats documentation.
Format as
There are two supported result format modes: Time series_ (default) and Table_. Table mode is suitable for use with a table panel when you want to display aggregated data. It works with raw events (returns all selected fields) and the stats search function, which returns table-like data. Results are similar to the Statistics tab in Splunk UI. Examples:
index="_internal" sourcetype="scheduler" | fields host, sourceindex="_internal" sourcetype="splunkd_access" | stats avg(bytes) as bytes, avg(file) as file by statusRead more about the stats function in the Splunk Search Reference
Annotations
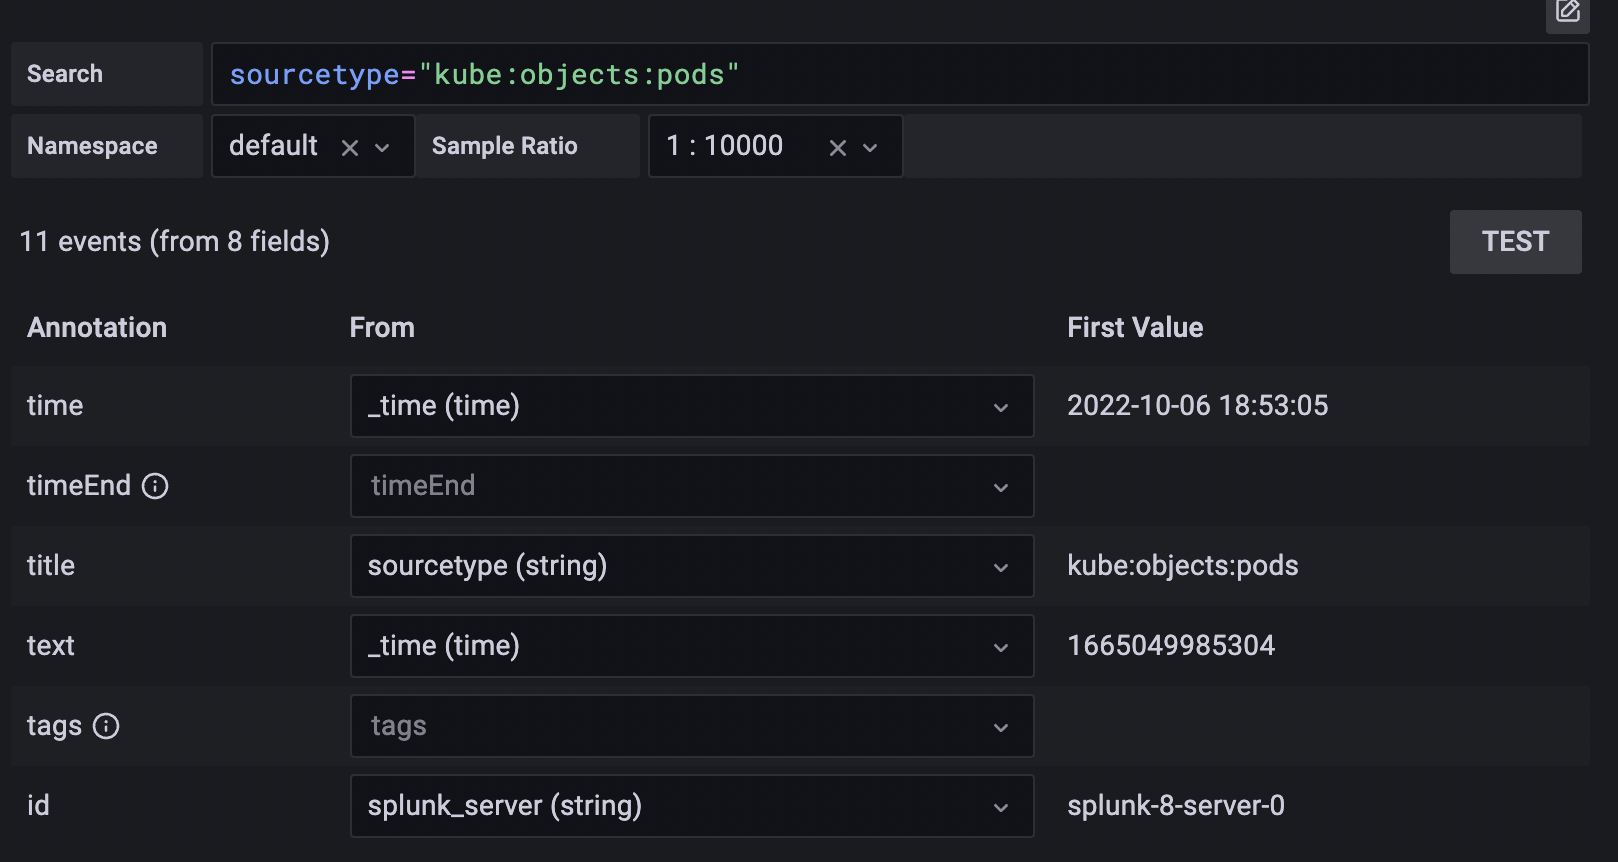
Use annotations if you want to show Splunk alerts or events on a graph. An annotation can either be a predefined Splunk alert or a regular splunk search. Select the desired fields to display in the annotation. Annotation text is displayed as shown in the example below.

Was this page helpful?
Related resources from Grafana Labs


