
Important: This documentation is about an older version. It's relevant only to the release noted, many of the features and functions have been updated or replaced. Please view the current version.
Splunk data source for Grafana
The Splunk data source allows you to query and visualize Splunk data with Search Processing Language (SPL) or a visual SPL editor.
Requirements
This plugin has the following requirements:
- A Splunk account
- One of the following account types:
- Grafana Cloud: Pro customers, Advanced customers, or Pro trial users with the Enterprise plugin add-on enabled
- Grafana Enterprise: Customers with an activated license and a user with Grafana server or organization administration permissions
- The Enterprise plugin add-on enabled
Known limitations
There are no known limitations.
Install the data source
To install the data source, refer to Installation.
Configure the data source
To add a data source, refer to Add a data source, and fill in the following fields:
Basic fields
| Field | Description |
|---|---|
| Name | A name for this particular Splunk data source |
| URL | Your access method is Server. The URL needs to be accessible from the Grafana backend server. |
| Whitelisted Cookies | Grafana proxy deletes forwarded cookies by default. Specify the cookies by name that you wan to forward to the data source. |
Authentication fields
- Basic auth
- Enter a Splunk user name and password. Avoid using the default administration account. (Alternatively, you can use an authentication token in the Splunk details section) TLS Client Auth
- The built-in option for authenticating using TLS (Transport Layer Security) Skip TLS Verify
- Enable to skip verifying TLS With Credentials
- Enable to send credentials, such as cookies or authentication headers with cross-site requests. With CA Cert
- Enable to verify self-signed TLS. Forward OAuth Identity
- This auth option is part of the generic plugin auth toolkit, but does not function for this data source.
You can configure custom HTTP header data sources that are managed by Grafana’s provisioning. Doing so allows you to add HTTP headers to all requests that go to that data source. Configure the header name in the jsonData field, and the header value in the secureJsonData field.
Splunk details
Authentication token You can use an authentication token as an alternative to Basic auth
- Preview mode
- (EXPERIMENTAL) Enable to get search results as they become available. Under the hood, this option enables polling of the
jobs/{search_id}/results_previewSplunk API endpoint. - Auto cancel
- Number of seconds that a job can be inactive before it is automatically canceled. The default is 30 seconds. To never auto cancel, set to
0. - Poll result
- Run a search, and then periodically check for a result. Under the hood, this option runs a
search/jobsAPI call withexec_modeset tonormal. In such a case, the API request returns the job’s SID (security identifier), and then Grafana periodically checks the job status, in order to get job result. - This option might be helpful for slow queries. This option is disabled by default, and Grafana sets
exec_modetooneshot, which allows you to return the search result in the same API call. For more information about thesearch/jobsAPI endpoint, refer to thesearch/jobs/{search_id}/resultsin the Splunk documentation. - Internal fields filtration
- Enable to hide fields with names that start with
_. - Internal field pattern
- Regex pattern for removing internal fields from the result.
- Time stamp field
- Default time stamp field. For more information, refer to Time stamp and time ranges.
- Fields search mode
- When you use the visual query editor, the data source tries to get a list of available fields for the selected source type.
- quick uses the first available result from preview
- full waits for the job to finish to get full result
- Default earliest time
- Time offset format:
[+ | -]<integer><time_unit>For example,-1w. Time unit:s,m,h,d,w,mon,q,y - By using a default earliest time, you can prevent a search from spanning all of time, which might slow down Splunk. Some searches, such as template variable queries, cannot use a dashboard time range.
- Variables search mode
- Search mode for template variable queries.
- fast: turn field discovery off for event searches. No event or field data for stats searches.
- smart turn field discovery on for event searches. No event or field data for stats searches.
- verbose All event and field data.
Data links
Data links are typically used in Grafana’s explore mode. The data displays a link that allows you to associate data internally with other Grafana data sources, or externally with data via a URL.
Set up a data link by clicking the + Add button under the Data links header in data source settings.
- Field
- The field from which to parse data. Logging data in Splunk is often returned in the
_rawcolumn. - Label
- Given a key and value such as
color=white, the label is the key in this key/value pair. - Regex
- Given a key and value such as
color=white, the regex parses out the value in the key value pair from thefield. The regex is a matching regex, so you must provide one set of brackets for the matching expression. To match everything, use/(.*)/. You must wrap the regex in//.
Turn off Internal link to link to a URL that is based on the value parsed out of the Splunk logs.
URL: Use the variable ${__value.raw} to hold the value of the data parsed out with the regex. You can use this to construct a URL.
Turn on Internal link to use an external link and link one data source to another data source within Grafana.
Configure the data source with provisioning
It is possible to configure data sources using config files with Grafana’s provisioning system. You can read more about how it works and all the settings you can set for data sources on the provisioning docs page
apiVersion: 1
datasources:
  - name: Splunk
    type: grafana-splunk-datasource
    access: proxy
    basicAuth: true
    basicAuthUser: user
    editable: true
    enabled: true
    jsonData:
      advancedOptions: true
      fieldSearchType: quick
      internalFieldsFiltration: true
      tlsSkipVerify: true
      variableSearchLevel: fast
      previewMode: false
      clusteringStrategy: 1
    secureJsonData:
      basicAuthPassword: password
    url: splunk url
    version: 1
Query the data source
Query editor support two modes: spl and visual. To switch between these modes click hamburger icon at the right side of editor and select Toggle Editor Mode.
SPL mode
Use SPL mode by querying with Search Processing Language (SPL). Find more information on SPL here.
For time series data use timechart command. For example:
index=os sourcetype=cpu | timechart span=1m avg(pctSystem) as system, avg(pctUser) as user, avg(pctIowait) as iowait
index=os sourcetype=ps | timechart span=1m limit=5 useother=false avg(cpu_load_percent) by process_name
Grafana is a time-series-oriented application, and your search query returns time-series data (in the form of a timestamp and value, or a single value). Find more information about the timechart command, refer to timechart. For more search query examples, refer to Splunk® Enterprise Search Reference.
Splunk metrics and mstats
Splunk 7.x provides an mstats command for analyzing metrics, which you need to combine with the timeseries command for it to work properly. You must also set the prestats=t option.
Current syntax:
| mstats prestats=t avg(disk.disk_ops.read) avg(disk.disk_ops.write) WHERE index="collectd" by metric_name span=1m
| timechart avg(disk.disk_ops.read) avg(disk.disk_ops.write) span=1m

Deprecated syntax:
| mstats prestats=t avg(_value) AS Value WHERE index="collectd" metric_name="disk.disk_ops.read" OR metric_name="disk.disk_ops.write" by metric_name span=1m
| timechart avg(_value) span=1m by metric_name
For more information about the mstats command, refer to Splunk’s mstats documentation.
Format as
There are two supported result format modes - Time series (default) and Table. Table mode is suitable for using with a table panel when you want to display aggregated data. That works with raw events (returns all selected fields) and stats search function, which returns table-like data. Results are similar to Statistics tab in Splunk UI. Examples:
index="_internal" sourcetype="scheduler" | fields host, sourceindex="_internal" sourcetype="splunkd_access" | stats avg(bytes) as bytes, avg(file) as file by statusRead more about stats function usage in Splunk Search Reference
Visual mode
This mode provide visual step-by-step search functionality. This mode creates timechart splunk search by selecting an index, source type, and metrics, and set split by fields as needed. (HOW DO YOU RUN A VISUAL QUERY)
Metric
You can add multiple metrics to search by clicking plus button at the right side of metric row. Metric editor contains list of frequently used aggregations, but you can specify here any other function.
- Select or type an aggregation type. The default is
avg. - Select or type a field for the aggregation to use.
- (Optional) Fill out an alias.
Split by and where
You need to be using Time series mode to use Split by.
Select which fields to split by (these can be removed by selecting remove in the dropdown).
Click the + button after Where to select a where clause type. Each function in the where clause can be edited after selecting a where clause type (remove the where clause by selection remove in the comparator function)
Find out more at here.
Options
To learn more about timechart options, refer to timechart.
Annotations
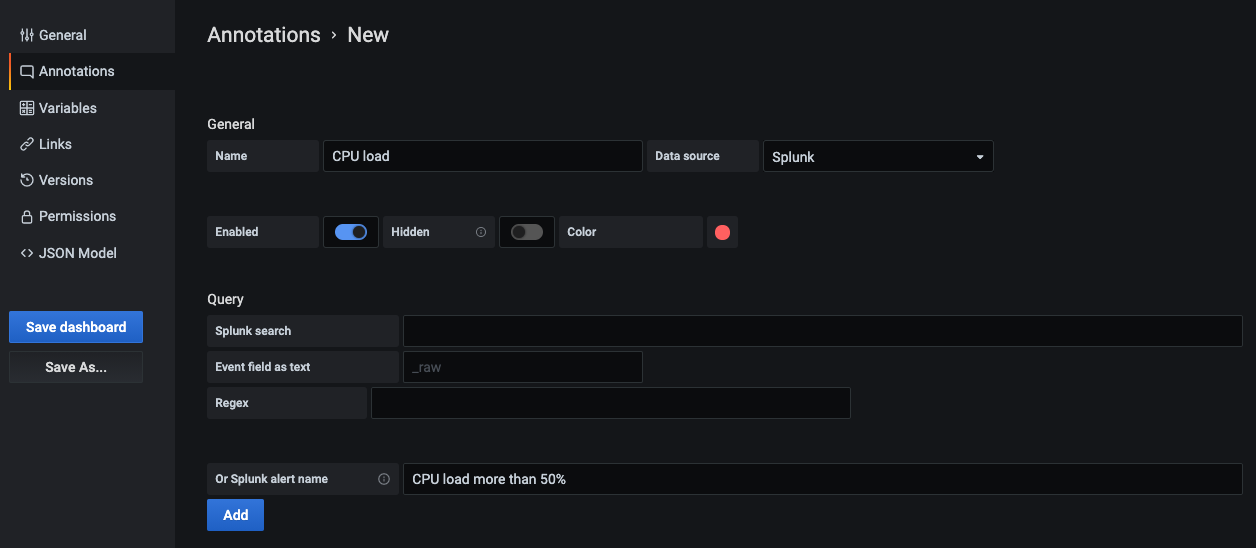
Use annotations if you want to show Splunk alerts or events on graph. Annotation can be either predefined Splunk alert or regular splunk search.
Splunk alert
Specify alert name or leave field blank to get all fired alerts. Template variables are supported.
Splunk search
Use splunk search to get needed events, for example:
index=os sourcetype=iostat | where total_ops > 400
index=os sourcetype=iostat | where total_ops > $io_threshold
Template variables are supported.
Event field as text option suitable if you want to use field value as annotation text. For example, error message text from logs:
Event field as text: _raw
Regex: WirelessRadioManagerd\[\d*\]: (.*)
Regex allows to extract a part of message.
Templates and variables
To add a new Splunk query variable, refer to Add a query variable. Use your Splunk data source as your data source.
Query with SPL to return list of values, for example with statscommand:
index=os sourcetype="iostat" | stats values(Device)This query returns list of Device field values from iostat source. Then you can use these device names for time series queries or annotations.
There are two possible types of variable queries can be used in Grafana:
- A simple query (as present above) which returns a list of values
- A query that can create a key/value variable. The query should return two columns that are named
_textand_value. The_textcolumn value should be unique (if it is not unique then the first value is used). The options in the dropdown will have a text and value that allows you to have a friendly name as text and an id as the value.
This search returns table with columns Name (Docker container name) and Id (container id):
source=docker_inspect | stats count latest(Name) as Name by Id | table Name, IdIn order to use container name as a visible value for variable and id as it’s real value, query should be modified, like:
source=docker_inspect | stats count latest(Name) as Name by Id | table Name, Id | rename Name as "_text", Id as "_value"Multi-value variables
It’s possible to use multi-value variables in queries. An interpolated search will be depending on variable usage context. There are a number of that contexts which plugin supports. Assume there’s a variable $container with selected values foo and bar:
Basic filter for
searchcommandsource=docker_stats $container => source=docker_stats (foo OR bar)Field-value filter
source=docker_stats container_name=$container
=>
source=docker_stats (container_name=foo OR container_name=bar)
Field-value filter with the
INoperator andin()functionsource=docker_stats container_name IN ($container) => source=docker_stats container_name IN (foo, bar) source=docker_stats | where container_name in($container) => source=docker_stats | where container_name in(foo, bar)
Multi-value variables and quotes
If variable wrapped in quotes (both double or single), its values also will be quoted:
source=docker_stats container_name="$container"
=>
source=docker_stats (container_name="foo" OR container_name="bar")

source=docker_stats container_name='$container'
=>
source=docker_stats (container_name='foo' OR container_name='bar')
After creating a variable it can be used in your Splunk queries by using this syntax.
For more information on variables refer this.
Import a dashboard for Splunk
Follow these instructions for importing a dashboard.
Imported dashboards can be found in Configuration > Data Sources > select your Splunk data source > select the Dashboards tab to see available pre-made dashboards.
See Dashboards for full details on currently available dashboards and their data dependencies.
Dashboards
The following dashboards are currently available:
- Kubernetes overview
- Node overview
- Pod overview
Dependencies
- Splunk 8 - These dashboards have been tested against Splunk 8.2.
- Grafana >= 8.2
- Splunk OpenTelemetry Connector for Kubernetes - For these dashboards to be populated, we require Kubernetes data to be ingested into Splunk. Currently, the dashboards utilise metrics only from this agent - the
otelK8sClusterReceiverandotelAgentdaemonset are required. We recommend using the helm chart provided by Splunk. - Splunk Open Connect - the helm chart can be used to collect Kubernetes events. Currently, the Open Telemetry connector does not collect this data. Once added, this agent will no longer be required.
When opening a dashboard, ensure you select an appropriate metrics and events index. These default to em_metrics and main respectively.
Kubernetes overview
This dashboard provides summary statistics on the cluster concerning capacity, resource utilization and pod state. Users can filter by cluster name and namespace.

Node overview
This dashboard provides summary statistics with respect to nodes in the cluster, allowing users to filter by node and cluster name.

Pod overview
This dashboard provides summary statistics with respect to nodes in the cluster, allowing users to filter by pod and cluster name.

Learn more
- Add Annotations.
- Configure and use Templates and variables.
- Add Transformations.
- Set up alerting; refer to Alerts overview.
Was this page helpful?
Related resources from Grafana Labs


