
Important: This documentation is about an older version. It's relevant only to the release noted, many of the features and functions have been updated or replaced. Please view the current version.
Grafana datasource for SAP HANA®
SAP HANA® is a high-performance, in-memory database that speeds up data-driven, real-time decisions and actions. It is developed and marketed by SAP®. Grafana’s SAP HANA data source plugin helps you to connect your SAP HANA instance with Grafana.
With the SAP HANA® Grafana Enterprise plugin, you can visualize your SAP HANA data alongside all of your other data sources in Grafana as well as log and metric data in context. This plugin includes a built-in query editor, supports annotations, and it allows you to set alerting thresholds, control access, set permissions, and more. This plugin is available to customers with a Grafana Enterprise license.

Making the most of SAP HANA® and Grafana Enterprise
Visualize SAP HANA data without moving it: Grafana queries data directly where it lives rather than moving it, which often requires you to pay for redundant storage and ingestion.
Compose panels from multiple sources: With pre-built and customized dashboards, present data from many different data sources within a single dashboard.
Transform and compute at the user level: With less data preparation, a user can transform data and run various computations.
Combine, compute, and visualize within panels: Create mixed data source panels that display related data from SAP HANA and other sources.
Requirements
This plugin has the following requirements:
- SAP HANA® URL, username, and password, along with the necessary permissions
- Connectivity between a Grafana server and a SAP HANA® server, which might be protected by firewall rules, in which case you need to allow Grafana’s IP to connect
- One of the following account types:
- Grafana Cloud: Pro customers, Advanced customers, or Pro trial users with the Enterprise plugin add-on enabled
- Grafana Enterprise: Customers with an activated license and a user with Grafana server or organization administration permissions
- The Enterprise plugin add-on enabled
Features
Query editor: The plugin comes with an built-in SQL query editor with syntax highlighting that allows you to visualize time series or table data and auto completes basic Grafana macros.
Data source permissions: Control who can view or query SAP HANA data in Grafana.
Annotations: Overlay SAP HANA events or data on any Grafana graph to correlate events with other graph data.
Alerting: Set alerts-based metrics stores in SAP HANA.
Variables for queries: Create template variables in Grafana, which are based on SAP HANA data, and include variables in SAP HANA queries to make dashboards interactive.
Query editor
SAP HANA® Grafana plugin comes with an SQL query editor where you can enter any HANA queries. If your query return timeseries data, you can format it as timeseries for visualizing them in a graph panel.
The query editor provides auto completion for supported Grafana macros and syntax highlighting of your SQL query.

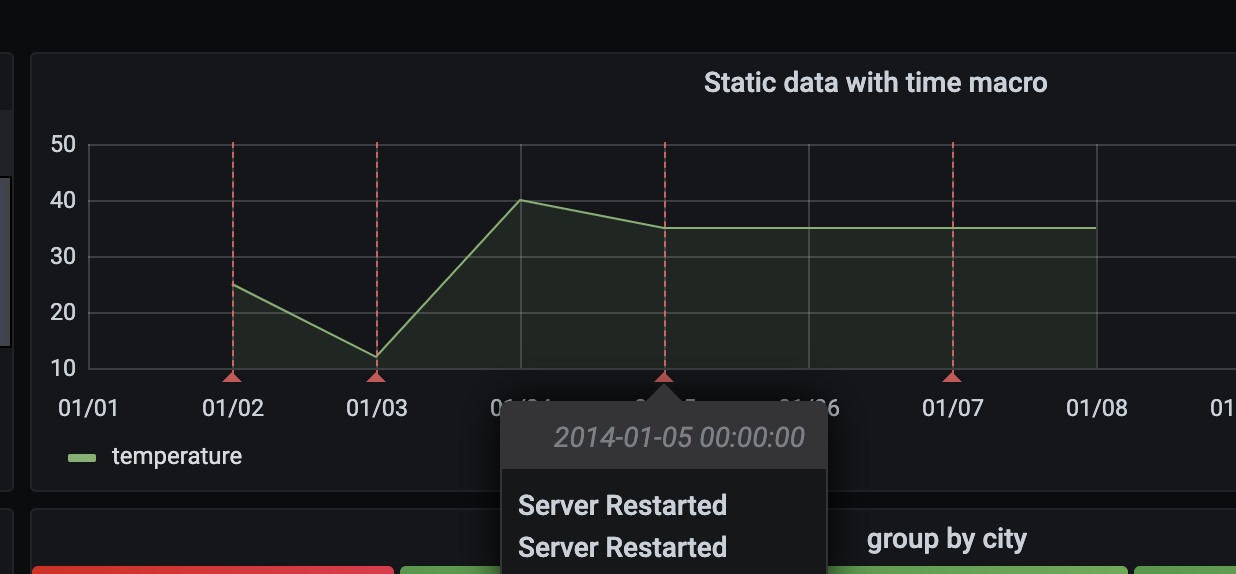
Annotations
You can use SAP HANA queries as the sources of Grafana annotations. Your annotation query should return at least one time column and one text column. For more information about annotations, refer to Annotations.
Create annotations from SAP HANA
- Click the Dashboard settings gear icon.
- From the left-hand menu, click Annotations and click the New.
- From the Data source drop-down menu, select your SAP HANA data source instance.
- In the Query field, enter a SAP HANA query that returns at least one time field and one text field.
- From the Format as drop-down menu, select Time Series.
- For each annotation, configure the From fields.
Note: The annotations feature is available in Grafana 7.2 or higher.
Annotations editor

Annotations in a graph panel
Templates and variables
For more information about variables, refer to Templates and variables.
Creating Grafana variables from an SAP HANA query
To add a new SAP HANA query variable, refer to Add a query variable.
- From the Dashboard settings gear icon, click Variables, and then click the New button.
- Using the “Query” variable type, select the SAP HANA data source as the “Datasource”.
- Enter the SAP HANA query that returns list of items.
Example :
The following query returns the distinct list of username from users table:
select distinct("username") from "users"Be sure to only select 1 column in your variable query. If your query returns 2 columns, first column will used as display value and 2nd column will be used as the actual value of the variable. If your query returns more than 2 columns, they will be rejected.
Using Grafana variables in SAP HANA Query
You can use any grafana variable in your query. Following examples shows how to use the single / multi variable in your query.
-- For example, following query
select * from "users" where "city" = ${city}
-- will be translated into
select * from "users" where "city" = 'london'
--- where you can see ${city} variable translated into actual value in the variable
Similar to text, variables also works for numeric fields. In the below example, ${age} is a text box variable where it accepts numbers and then compares against the numeric field in the table.
select * from "users" where "age" > ${age}
--- wil be translated into
select * from "users" where "age" > '36'
If your variable returns multiple values, then you can use it in SAP HANA query’s in condition like below. Note the brackets surrounding the variable to make the where in condition valid in SAP HANA.
select * from "users" where "city" in (${cities})
--- will be translated into
select * from "users" where "city" in ('london','perth','delhi')
--- where you can see ${cities} turned into a list of grafana variables selected.
--- You can also write the same query using shorthand notation as shown below
select * from "users" where "city" in ($cities)
Macros in SAP HANA® Query
| Macro | Description |
|---|---|
$__timeFilter(<time_column>) | Applies Grafana’s time range to the specified column when used in the raw query. Applicable to date/timestamp/long time columns. |
$__timeFilter(<time_column>,<format>) | Same as above. But gives the ability to specify the format of the time_column stored in the database. |
$__timeFilter(<time_column>,"epoch",<format>) | Same as above but can be used when your time column is in epoch. format can be one of ’s’,‘ms’ and ’ns’. |
$__fromTimeFilter(<time_column>) | Returns time condition based on grafana’s from time over a time field |
$__fromTimeFilter(<time_column>,<comparison_predicate>) | Same as above but able to specify comparison_predicate |
$__fromTimeFilter(<time_column>,<format>) | Same as above but able to specify format of the time column |
$__fromTimeFilter(<time_column>,<format>,<comparison_predicate>) | Same as above but able to specify comparison_predicate |
$__toTimeFilter(<time_column>) | Returns time condition based on grafana’s to time over a time field |
$__toTimeFilter(<time_column>,<comparison_predicate>) | Same as above but able to specify comparison_predicate |
$__toTimeFilter(<time_column>,<format>) | Same as above but able to specify format of the time column |
$__toTimeFilter(<time_column>,<format>,<comparison_predicate>) | Same as above but able to specify comparison_predicate |
$__timeGroup(<time_column>,<interval>) | Expands the time column into interval groups. Applicable to date/timestamp/long time columns. |
$__timeFilter(<time_column>) macro
Below example explains the $__timeFilter(<time_column>) macro.
-- In the following example, the query
select ts, temperature from weather where $__timeFilter(ts)
--- will be translated into
select ts, temperature from weather where ts > '2021-02-24T12:52:48Z' AND ts < '2021-03-24T12:52:48Z'
--- where you can see the grafana dashboard's time range is applied to the column ts in the query.
$__timeFilter(<time_column>,\<format>) macro
In some cases, time columns in the database may stored in custom formats. Below example explains the $__timeFilter(<time_column>,<format>) macro which helps to filter custom timestamps based on grafana’s time picker.
SELECT TO_TIMESTAMP("TS",'YYYYMMDDHH24MISS') AS METRIC_TIME , "VALUE" FROM "SCH"."TBL" WHERE $__timeFilter("TS","YYYYMMDDHH24MISS") -- TS is in 20210421162012 format
SELECT TO_TIMESTAMP("TS",'YYYY-MON-DD') AS METRIC_TIME , "VALUE" FROM "SCH"."TBL" WHERE $__timeFilter("TS","YYYY-MON-DD") -- TS is in 2021-JAN-15 format
In the macro, format can be one of valid HANA formats matching your timestamp column. Example: YYYYMMDDHH24MISS is a valid format when your data is stored in 20210421162012 format.
$__timeFilter(<time_column>,"epoch",\<format>) macro
In some cases, you may have timestamp stored as epoch timestamps in your DB. Below example explains the $__timeFilter(<time_column>,"epoch",<format>) macro which helps to filter epoch timestamps based on grafana’s time picker. In the macro, format can be one of ms,s or ns. If not specified, s will be treated as default format.
SELECT ADD_SECONDS('1970-01-01', "TIMESTAMP") AS "METRIC_TIME", "VALUE" FROM "SCH"."TBL" WHERE $__timeFilter("TIMESTAMP","epoch") -- Example : TIMESTAMP field stored in epoch_second format 1257894000
SELECT ADD_SECONDS('1970-01-01', "TIMESTAMP") AS "METRIC_TIME", "VALUE" FROM "SCH"."TBL" WHERE $__timeFilter("TIMESTAMP","epoch","s") -- Example : TIMESTAMP field stored in epoch_second format 1257894000
SELECT ADD_SECONDS('1970-01-01', "TIMESTAMP"/1000) AS "METRIC_TIME", "VALUE" FROM "SCH"."TBL" WHERE $__timeFilter("TIMESTAMP","epoch","ms") -- Example : TIMESTAMP field stored in epoch_ms format 1257894000000
SELECT ADD_SECONDS('1970-01-01', "TIMESTAMP"/1000000000) AS "METRIC_TIME", "VALUE" FROM "SCH"."TBL" WHERE $__timeFilter("TIMESTAMP","epoch","ns") -- Example : TIMESTAMP field stored in epoch_nanoseconds format 1257894000000000000
Instead of using third argument to the $__timeFilter, you can use one of epoch_s, epoch_ms or epoch_ns as your second argument.
SELECT ADD_SECONDS('1970-01-01', "TIMESTAMP"/1000) AS "METRIC_TIME", "VALUE" FROM "SCH"."TBL" WHERE $__timeFilter("TIMESTAMP","epoch","ms")
-- is same as
SELECT ADD_SECONDS('1970-01-01', "TIMESTAMP"/1000) AS "METRIC_TIME", "VALUE" FROM "SCH"."TBL" WHERE $__timeFilter("TIMESTAMP","epoch_ms")
$__fromTimeFilter() & $__toTimeFilter() macros
$__fromTimeFilter() macro expands to a condition over a time field based on grafana time picker’s from time.
This accepts three parameters. First parameter is time field name. You can pass comparison_predicate or format of the time column as second argument. If you want to pass both, then format is second parameter and use comparison_predicate as your third parameter.
<format> If the format is not specified, plugin wil assume that the time column is of timestamp/date type. If your time column is stored in any other format than timestamp/date, then pass the format as second argument. <format> can be one of epoch_s, epoch_ms,epoch_ns or any other custom format like YYYY-MM-DD.
<comparison_predicate>: optional parameter. If not passed, plugin will use > as comparison predicate. <comparison_predicate> can be one of =, !=, <>, <, <=, >, >=
$__toTimeFilter() works same as $__fromTimeFilter(). Instead of using grafana’s from time, it will use to time. Also the default comparison predicate will be <.
See macro examples below for examples.
$__timeGroup(<time_column>,<interval>) macro
For example, the macro $__timeGroup(timecol,1h) is expanded to SERIES_ROUND("timecol", 'INTERVAL 1 HOUR') in the query. For more information about SERIES_ROUND function, refer to SAP HANA Documentation. Following intervals are valid within SAP HANA interval query.
| Interval | Duration |
|---|---|
| m | MINUTE |
| s | SECOND |
| h | HOUR |
| d | DAY |
| M | MONTH |
| y | YEAR |
Example:
Below example explains the $__timeGroup(<time_column>,<interval>) macro. Interval should be in one of the format 1h, 3m etc.
SELECT $__timeGroup(timestamp,1h),  "user", sum("value") as "value"
FROM "salesdata"
WHERE $__timeFilter("timestamp")
GROUP BY $__timeGroup(timestamp,1h), "user"
ORDER BY $__timeGroup(timestamp,1h) ASC
will be translated into below query where $__timeGroup(timestamp,1h) is expanded into SERIES_ROUND("timestamp", 'INTERVAL 1 HOUR')
SELECT SERIES_ROUND("timestamp", 'INTERVAL 1 HOUR') as "timestamp",  "user", sum("value") as "value"
FROM "salesdata"
WHERE "timestamp" > '2020-01-01T00:00:00Z' AND "timestamp" < '2020-01-01T23:00:00Z'
GROUP BY SERIES_ROUND("timestamp", 'INTERVAL 1 HOUR'), "user"
ORDER BY "timestamp" ASC
Note: When using group by with
$__timeGroupmacro, make sure that your select, sort by fields follows the same name as your group by field. Otherwise, HANA may not recognize the query.
If you don’t want to hard code the interval in $__timeGroup() function, then you can leave that to grafana by specifying $__interval as your interval. Grafana will calculate that interval from dashboard time range. Example query given below.
SELECT $__timeGroup(timestamp, $__interval), sum("value") as "value"
FROM "salesdata"
WHERE $__timeFilter("timestamp")
GROUP BY $__timeGroup(timestamp, $__interval)
ORDER BY $__timeGroup(timestamp, $__interval) ASC
will be translated into the following query based on dashboard time range.
SELECT SERIES_ROUND("timestamp", 'INTERVAL 1 MINUTE'), sum("value") as "value"
FROM "salesdata"
WHERE "timestamp" > '2019-12-31T23:09:14Z' AND "timestamp" < '2020-01-01T23:17:54Z'
GROUP BY SERIES_ROUND("timestamp", 'INTERVAL 1 MINUTE')
ORDER BY SERIES_ROUND("timestamp", 'INTERVAL 1 MINUTE') ASC
You can also use any other macros as described here.
Macro examples
Below are examples of different macros when grafana have 2014-11-12T11:45:26.371Z as from time and 2015-11-12T11:45:26.371Z as to time.
| Format | Expands to |
|---|---|
$__timeFilter("TS") | "TS" > '2014-11-12T11:45:26Z' AND "TS" < '2015-11-12T11:45:26Z' |
$__timeFilter("TS","YYYYMMDDHH24MISS") | TO_TIMESTAMP("TS",'YYYYMMDDHH24MISS') > '2014-11-12T11:45:26Z' AND TO_TIMESTAMP("TS",'YYYYMMDDHH24MISS') < '2015-11-12T11:45:26Z' |
$__timeFilter("TS","epoch_ms") | "TS" > '1415792726000' AND "TS" < '1447328726000' |
$__timeFilter("TS","epoch_ns") | "TS" > '1415792726000000000' AND "TS" < '1447328726000000000' |
$__fromTimeFilter("TS") | "TS" > '2014-11-12T11:45:26Z' |
$__fromTimeFilter("TS","epoch") | ADD_SECONDS( '1970-01-01', "TS" ) > '2014-11-12T11:45:26Z' |
$__fromTimeFilter("TS","epoch_s") | ADD_SECONDS( '1970-01-01', "TS" ) > '2014-11-12T11:45:26Z' |
$__fromTimeFilter("TS","epoch_ms") | ADD_SECONDS( '1970-01-01', ("TS" / 1000)) > '2014-11-12T11:45:26Z' |
$__fromTimeFilter("TS","epoch_ns") | ADD_SECONDS( '1970-01-01', ("TS" / 1000000000)) > '2014-11-12T11:45:26Z' |
$__fromTimeFilter("TS","YYYYMMDDHH24MISS") | TO_TIMESTAMP("TS",'YYYYMMDDHH24MISS') > '2014-11-12T11:45:26Z' |
$__fromTimeFilter("TS",">=") | "TS" >= '2014-11-12T11:45:26Z' |
$__fromTimeFilter("TS","epoch_ms",">=") | ADD_SECONDS( '1970-01-01', ("TS" / 1000)) >= '2014-11-12T11:45:26Z' |
$__fromTimeFilter("TS","YYYYMMDDHH24MISS",">=") | TO_TIMESTAMP("TS",'YYYYMMDDHH24MISS') >= '2014-11-12T11:45:26Z' |
$__toTimeFilter("TS") | "TS" < '2015-11-12T11:45:26Z' |
$__timeGroup("TS","1h") | SERIES_ROUND("TS", 'INTERVAL 1 HOUR') |
$__timeGroup("TS","$__interval") | SERIES_ROUND("TS", 'INTERVAL 6 HOUR') |
Visualizing data as logs
To visualize the data in the Logs viewer in explorer, use the Logs format in your query.
When you query using the Logs format, include at least one time column, and one string column, or content column in your query. Optionally, you can set the log level of the particular row, by using a third column called level. For information about the supported log levels and their keywords, see Logs in Explore. If the query returns any additional columns, they will be treated as additional fields or detected fields in the logs.
Here is an example of a valid log query:
SELECT 'hello foo' AS "content", timestamp'2021-12-31 23:59:59' AS "start_time", 'warn'  AS "level" FROM DUMMY UNION
SELECT 'hello bar' AS "content", timestamp'2021-12-30 14:12:59' AS "start_time", 'error' AS "level"FROM DUMMY  UNION
SELECT 'hello baz' AS "content", timestamp'2021-12-30 23:59:59' AS "start_time", 'warn' AS "level" FROM DUMMY UNION
SELECT 'hello qux' AS "content", timestamp'2021-12-29 23:59:59' AS "start_time", 'info' AS "level" FROM DUMMY UNION
SELECT 'hello quux' AS "content", timestamp'2021-12-28 23:59:59' AS "start_time", 'unknown' AS "level" FROM DUMMY UNION
SELECT 'hello quuz' AS "content", timestamp'2021-12-27 23:59:59' AS "start_time", 'info' AS "level" FROM DUMMY;
Alerting
Easily set up alerts on specific SAP HANA metrics or alert on queries you’ve created:
Steps to create a SAP HANA alert in Grafana
- Create a graph panel in your dashboard
- Create a SAP HANA query in time series format
- Click the Alert tab and specify the alerting criteria
- Click Test Rule button to test your alert query
- Specify the alert recipients, message and error handling
- Save the dashboard

Alerting on non-timeseries data
If you need to setup alert on non-timeseries data, use TO_TIMESTAMP('${__to:date}') macro to make non-timeseries metrics into timeseries. This will convert your metric into single point time series query. Format of the query is given below
SELECT TO_TIMESTAMP('${__to:date}'), <METRIC> FROM <TABLE> WHERE <YOUR CONDITIONS>Example:
In the below example, table have four fields called username, age, city and role. This table doesn’t have any time field. We want to notify when the number of users with dev role is less than 3.
SELECT  TO_TIMESTAMP('${__to:date}'), count(*) as "count" FROM (
   SELECT 'John' AS "username", 32 AS "age", 'Chennai' as "city", 'dev' as "role" FROM dummy
   UNION ALL SELECT 'Jacob' AS "username", 32 AS "age", 'London' as "city", 'accountant' as "role" FROM dummy
   UNION ALL SELECT 'Ali' AS "username", 42 AS "age", 'Delhi' as "city", 'admin' as "role" FROM dummy
   UNION ALL SELECT 'Raja' AS "username", 12 AS "age", 'New York' as "city", 'ceo' as "role" FROM dummy
   UNION ALL SELECT 'Sara' AS "username", 35 AS "age", 'Cape Town' as "city", 'dev' as "role" FROM dummy
   UNION ALL SELECT 'Ricky' AS "username", 25 AS "age", 'London' as "city", 'accountant' as "role" FROM dummy
   UNION ALL SELECT 'Angelina' AS "username", 31 AS "age", 'London' as "city", 'cxo' as "role" FROM dummy
) WHERE "role" = 'dev'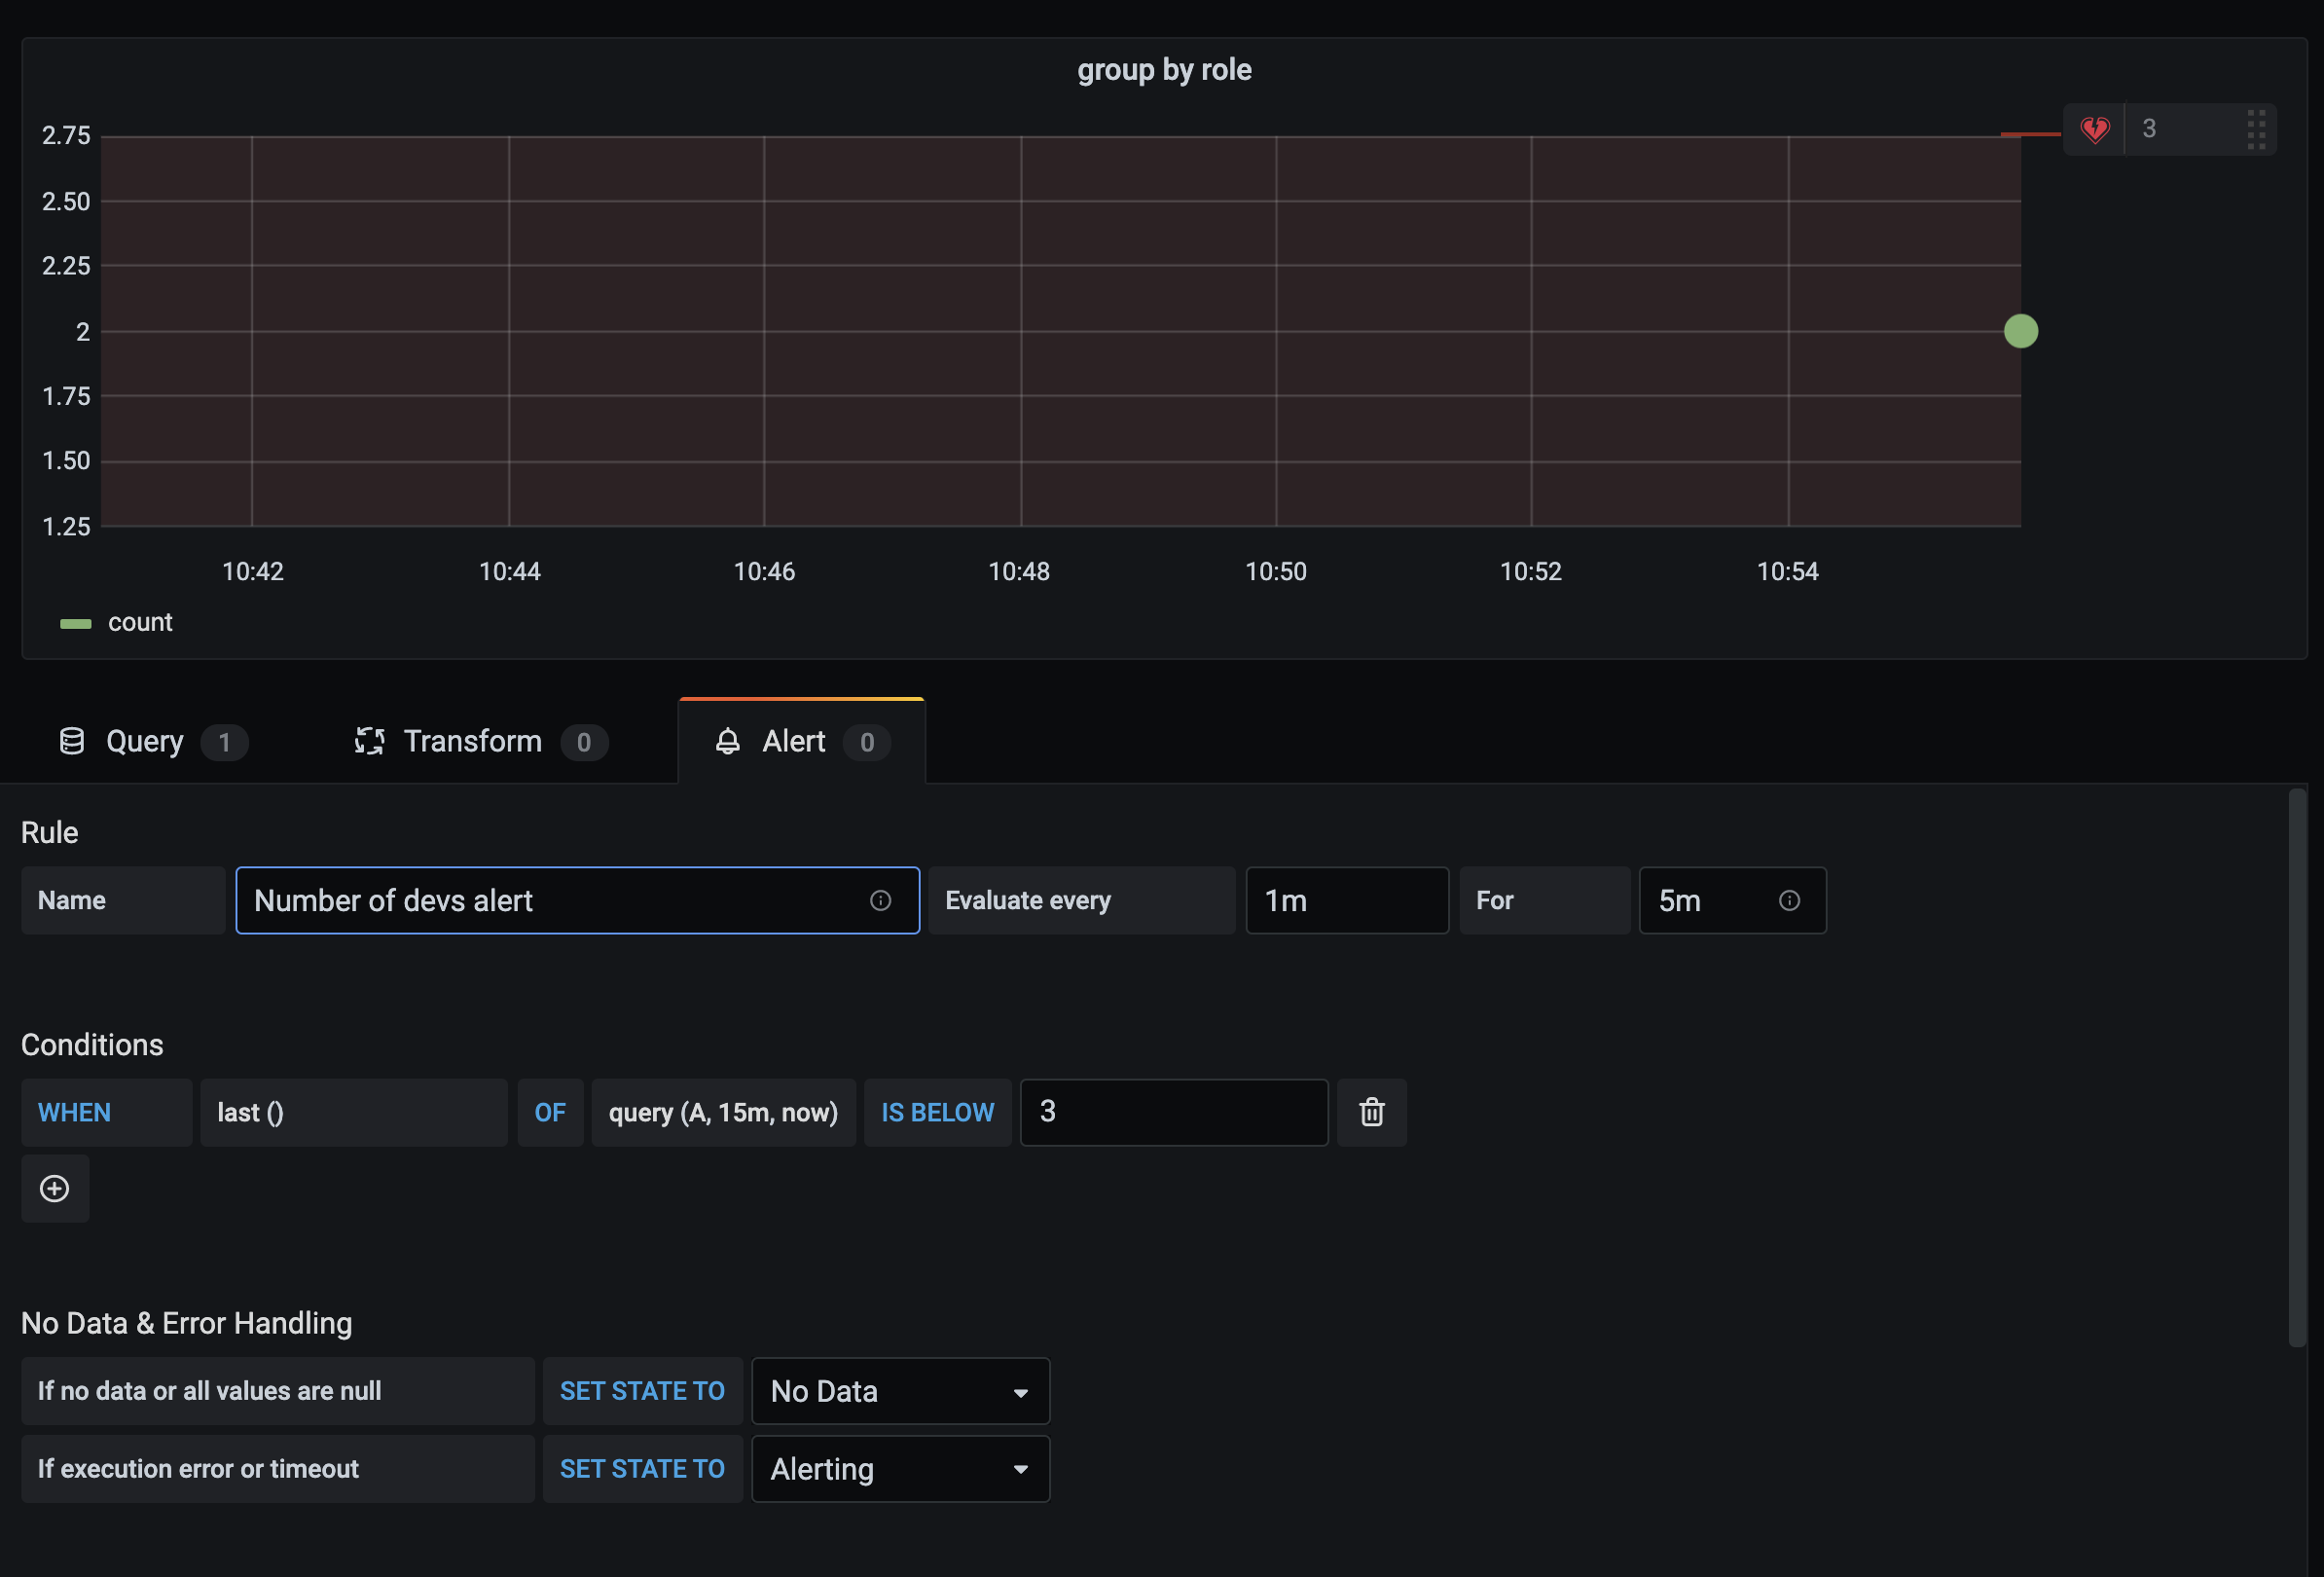
Configuration
Once the SAP HANA® Grafana plugin is installed, perform the following steps to configure a datasource.
- Login as admin user
- Navigate to Configuration from the grafana menu on the left
- Click Data Sources > Add data source and select SAP HANA
- Provide the necessary information as explained in config editor section.
Config Editor
Config editor requires the following information.
| Field Name | Details |
|---|---|
| Server address | mandatory Provide the address of the SAP HANA instance. Example : xxxxxxx-xxxx-xxxx-xxxx-xxxxxxx.hana.trial-us10.hanacloud.ondemand.com |
| Server port | mandatory Provide the port of the SAP HANA instance. Example : 443 / 39041. Usually SAP HANA cloud can be connected through 443 and on-prem/multi-tenanted instances can be connected via their respective port |
| Username | mandatory Username to be used to connect SAP HANA instance. Note: This user must have required permissions to query the database as explained below |
| Password | mandatory Password of the above user |
| Skip TLS verify | optional Enable this option if you required to skip TLS verification. Default value: false |
| TLS Client Auth | optional Enable this option if you need to provide client cert and key. Default value: false |
| With CA Cert | optional Needed for verifying self-signed TLS Certs Default value: false |
| Default schema | optional Default schema to be used. If not specified, you need to specify the schema in every query. |
Once you filled the above information, Click Save & Test. This action will validate the connection settings user credentials.
Note: Save & Test validation doesn’t check any access permissions to the schemas. You may need to explicitly grant schema read permissions to the user.
Find the right port to connect
When creating the data source config, You need to specify the correct port number of the SAP HANA® instance. For SAP HANA® cloud instance, usually it will be 443. For on-prem/multi-tenanted instances, you can find the respective port number by following the guidance given in SAP HANA® document
You can determine the ports used by a particular tenant database by querying the M_SERVICES system view, either from the tenant database itself or from the system database.
- From the tenant database:
SELECT SERVICE_NAME, PORT, SQL_PORT, (PORT + 2) HTTP_PORT FROM SYS.M_SERVICES WHERE ((SERVICE_NAME='indexserver' and COORDINATOR_TYPE= 'MASTER') or (SERVICE_NAME='xsengine')) - From the system database:
SELECT DATABASE_NAME, SERVICE_NAME, PORT, SQL_PORT, (PORT + 2) HTTP_PORT FROM SYS_DATABASES.M_SERVICES WHERE DATABASE_NAME='<DBNAME>' and ((SERVICE_NAME='indexserver' and COORDINATOR_TYPE= 'MASTER') or (SERVICE_NAME='xsengine'))
Access & Permissions
To connect Grafana to SAP HANA®, use dedicated credentials. Only provide required permissions to the user.
Step 1:
Create a restricted user with username and password. The below query is an example to create a restricted user. This query also disables the force password change.
CREATE RESTRICTED USER <USER> PASSWORD <PASSWORD> NO FORCE_FIRST_PASSWORD_CHANGE;Step 2:
Allow the the user to connect the system through clients such as grafana
ALTER USER <USER> ENABLE CLIENT CONNECT;Step 3:
Give user access to necessary views / tables / schemas
ALTER USER <USER> GRANT ROLE PUBLIC;
GRANT SELECT ON SCHEMA <SCHEMA> TO <USER>;
User level permissions
Limit access to SAP HANA by clicking on the Permissions tab in the datasource configuration page to enable data source permissions. On the permission page, Admins can enable permissions and restrict query permissions to specific Users and Teams.
Provisioning
Instead the Grafana UI, you can provision the datasource using Grafana’s provisioning feature. Example provisioning file given below
apiVersion: 1
datasources:
  - name: SAP HANA
    type: grafana-saphana-datasource
    uid: sap_hana
    access: proxy
    orgId: 1
    jsonData:
      server: xxxxxx-xxxxxx-xxxxxx-xxxxxx-xxxxxx.hana.trial-us10.hanacloud.ondemand.com
      port: 443
      username: GRAFANA_HANA_USERNAME
      tlsSkipVerify: false
      tlsAuth: false
      tlsAuthWithCACert: false
      defaultSchema: EXAMPLE
    secureJsonData:
      password: $SECURE_HANA_PASSWORD_FROM_ENVIRONMENT_VAR
      tlsCACert:
      tlsClientCert:
      tlsClientKey:
    version: 1
    editable: false
Learn More
- Add Annotations.
- Configure and use Templates and variables.
- Add Transformations.
- Set up alerting; refer to Alerts overview.
- SAP HANA®.
- SAP HANA® Documentation.
- SAP HANA® SQL Reference.
- SAP HANA® Series Data Reference.
SAP HANA® is the trademark or registered trademark of SAP SE or its affiliates in Germany and in several other countries.
Was this page helpful?
Related resources from Grafana Labs


