

Jenkins data source
Note
Jenkins data source is currently in public preview. Grafana Labs offers limited support, and breaking changes might occur prior to the feature being made generally available.
Jenkins is an open source automation server used to build and deploy projects as part of Continuous Integration (CI) and Continuous Deployment (CD) pipelines.
The Jenkins data source plugin allows you to query and visualize metrics such as projects, builds, build queues, nodes, and load statistics from within Grafana. You can use this information to measure performance against DORA metrics to assess your software delivery and operations performance.
Note
The Jenkins data source is an Enterprise plugin. It’s available with a Grafana Cloud Pro or Advanced plan and Grafana Enterprise. For installation instructions, refer to Install and upgrade the Jenkins data source plugin.
Supported features
Unlike observability data sources that return metrics, logs, or traces, the Jenkins data source queries the state of your CI/CD automation server. It retrieves the following data from your Jenkins instance:
For details on each query type and the fields it returns, refer to the Jenkins query editor.
The data source also supports the following Grafana capabilities:
Requirements
This plugin has the following requirements:
- A Grafana Cloud Pro or Advanced plan or an activated on-prem Grafana Enterprise license.
- Grafana version 10.4.8 or later.
- A Jenkins instance with the Remote Access API enabled.
Known limitations
The plugin currently does not support:
Get started
The following documents help you get started with the Jenkins data source:
- Install and upgrade the Jenkins data source plugin
- Configure the Jenkins data source
- Use the Jenkins query editor
- Use template variables with the Jenkins data source
- Troubleshoot the Jenkins data source
Import a dashboard for Jenkins
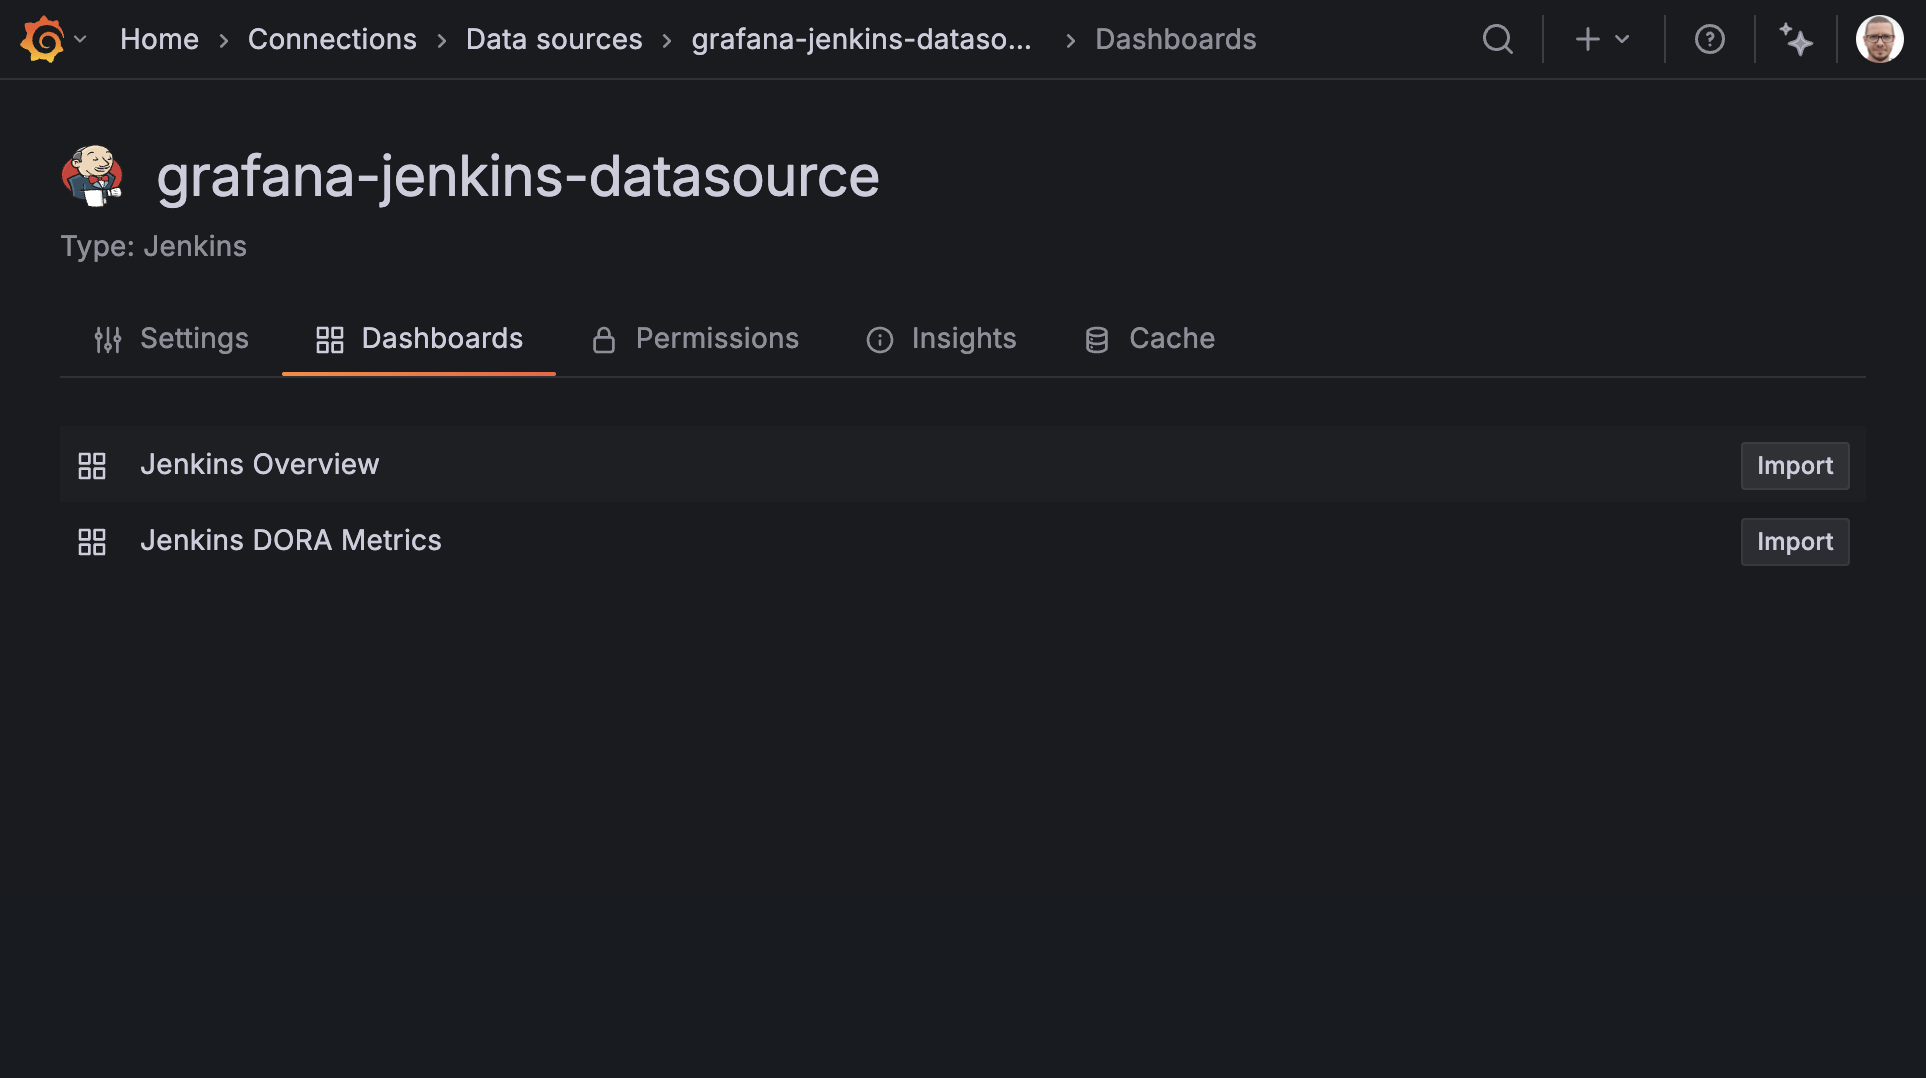
This plugin includes two built-in dashboards to help you quickly get started visualizing Jenkins data.
To import the dashboards, you must first install the plugin and configure a data source.
From the data source configuration page, navigate to the Dashboards tab where you see a list of available dashboards.
Click the Import button next to any dashboard you want to import.
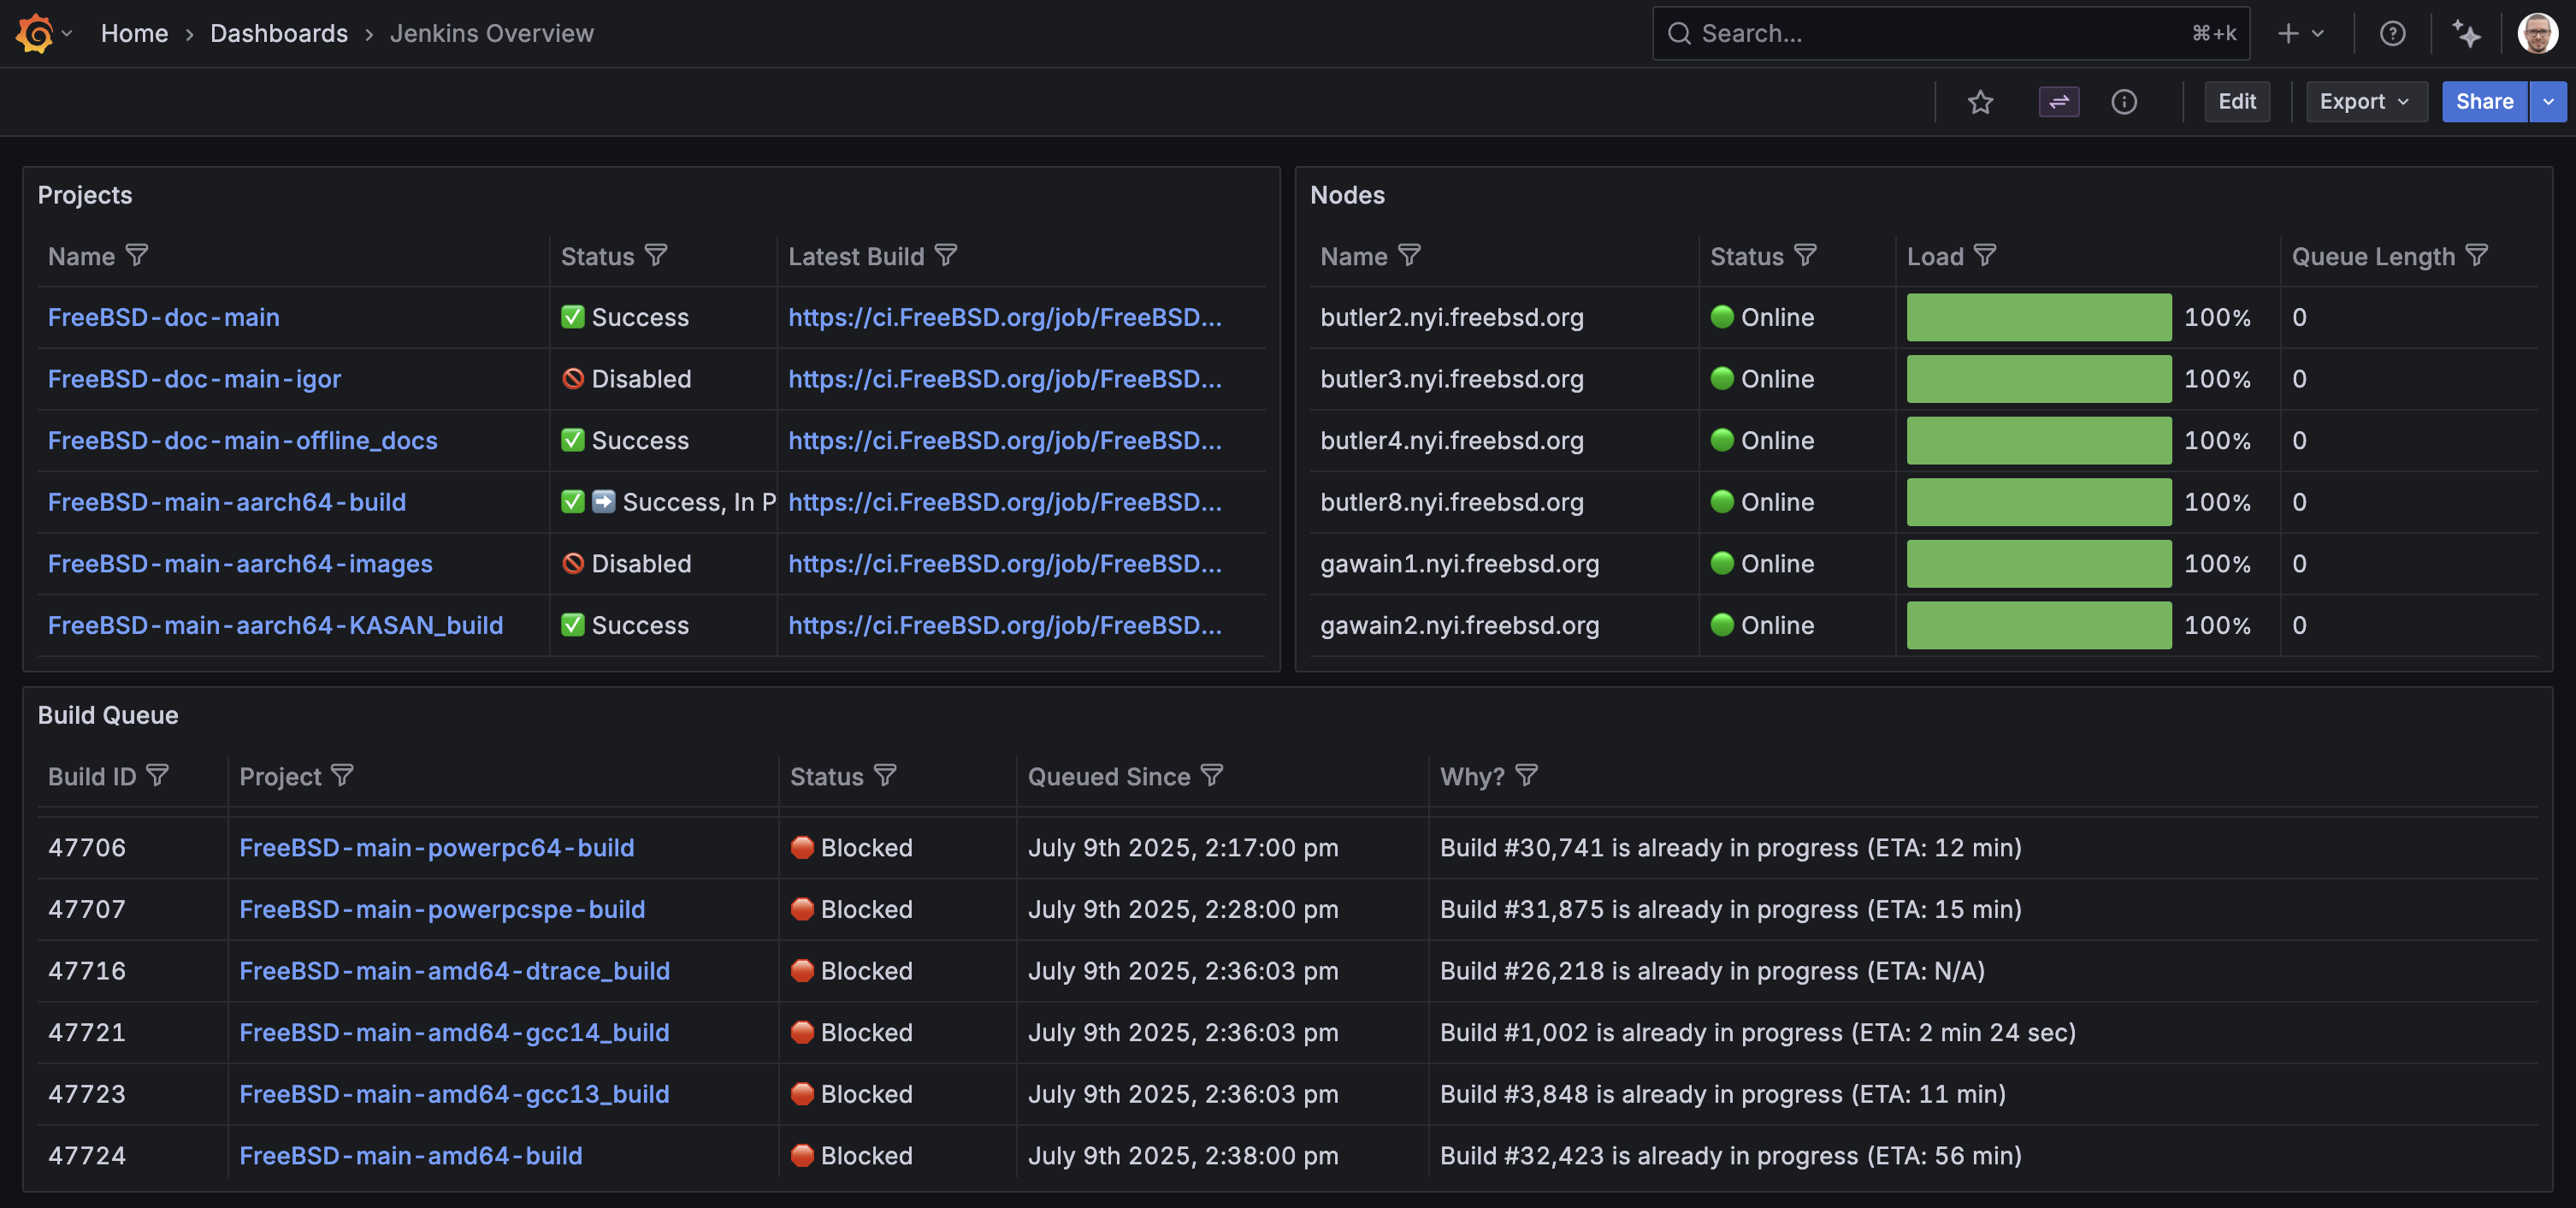
Jenkins Overview
This dashboard provides an overview of the Jenkins instance, including all projects, nodes, executor status, and build queue.
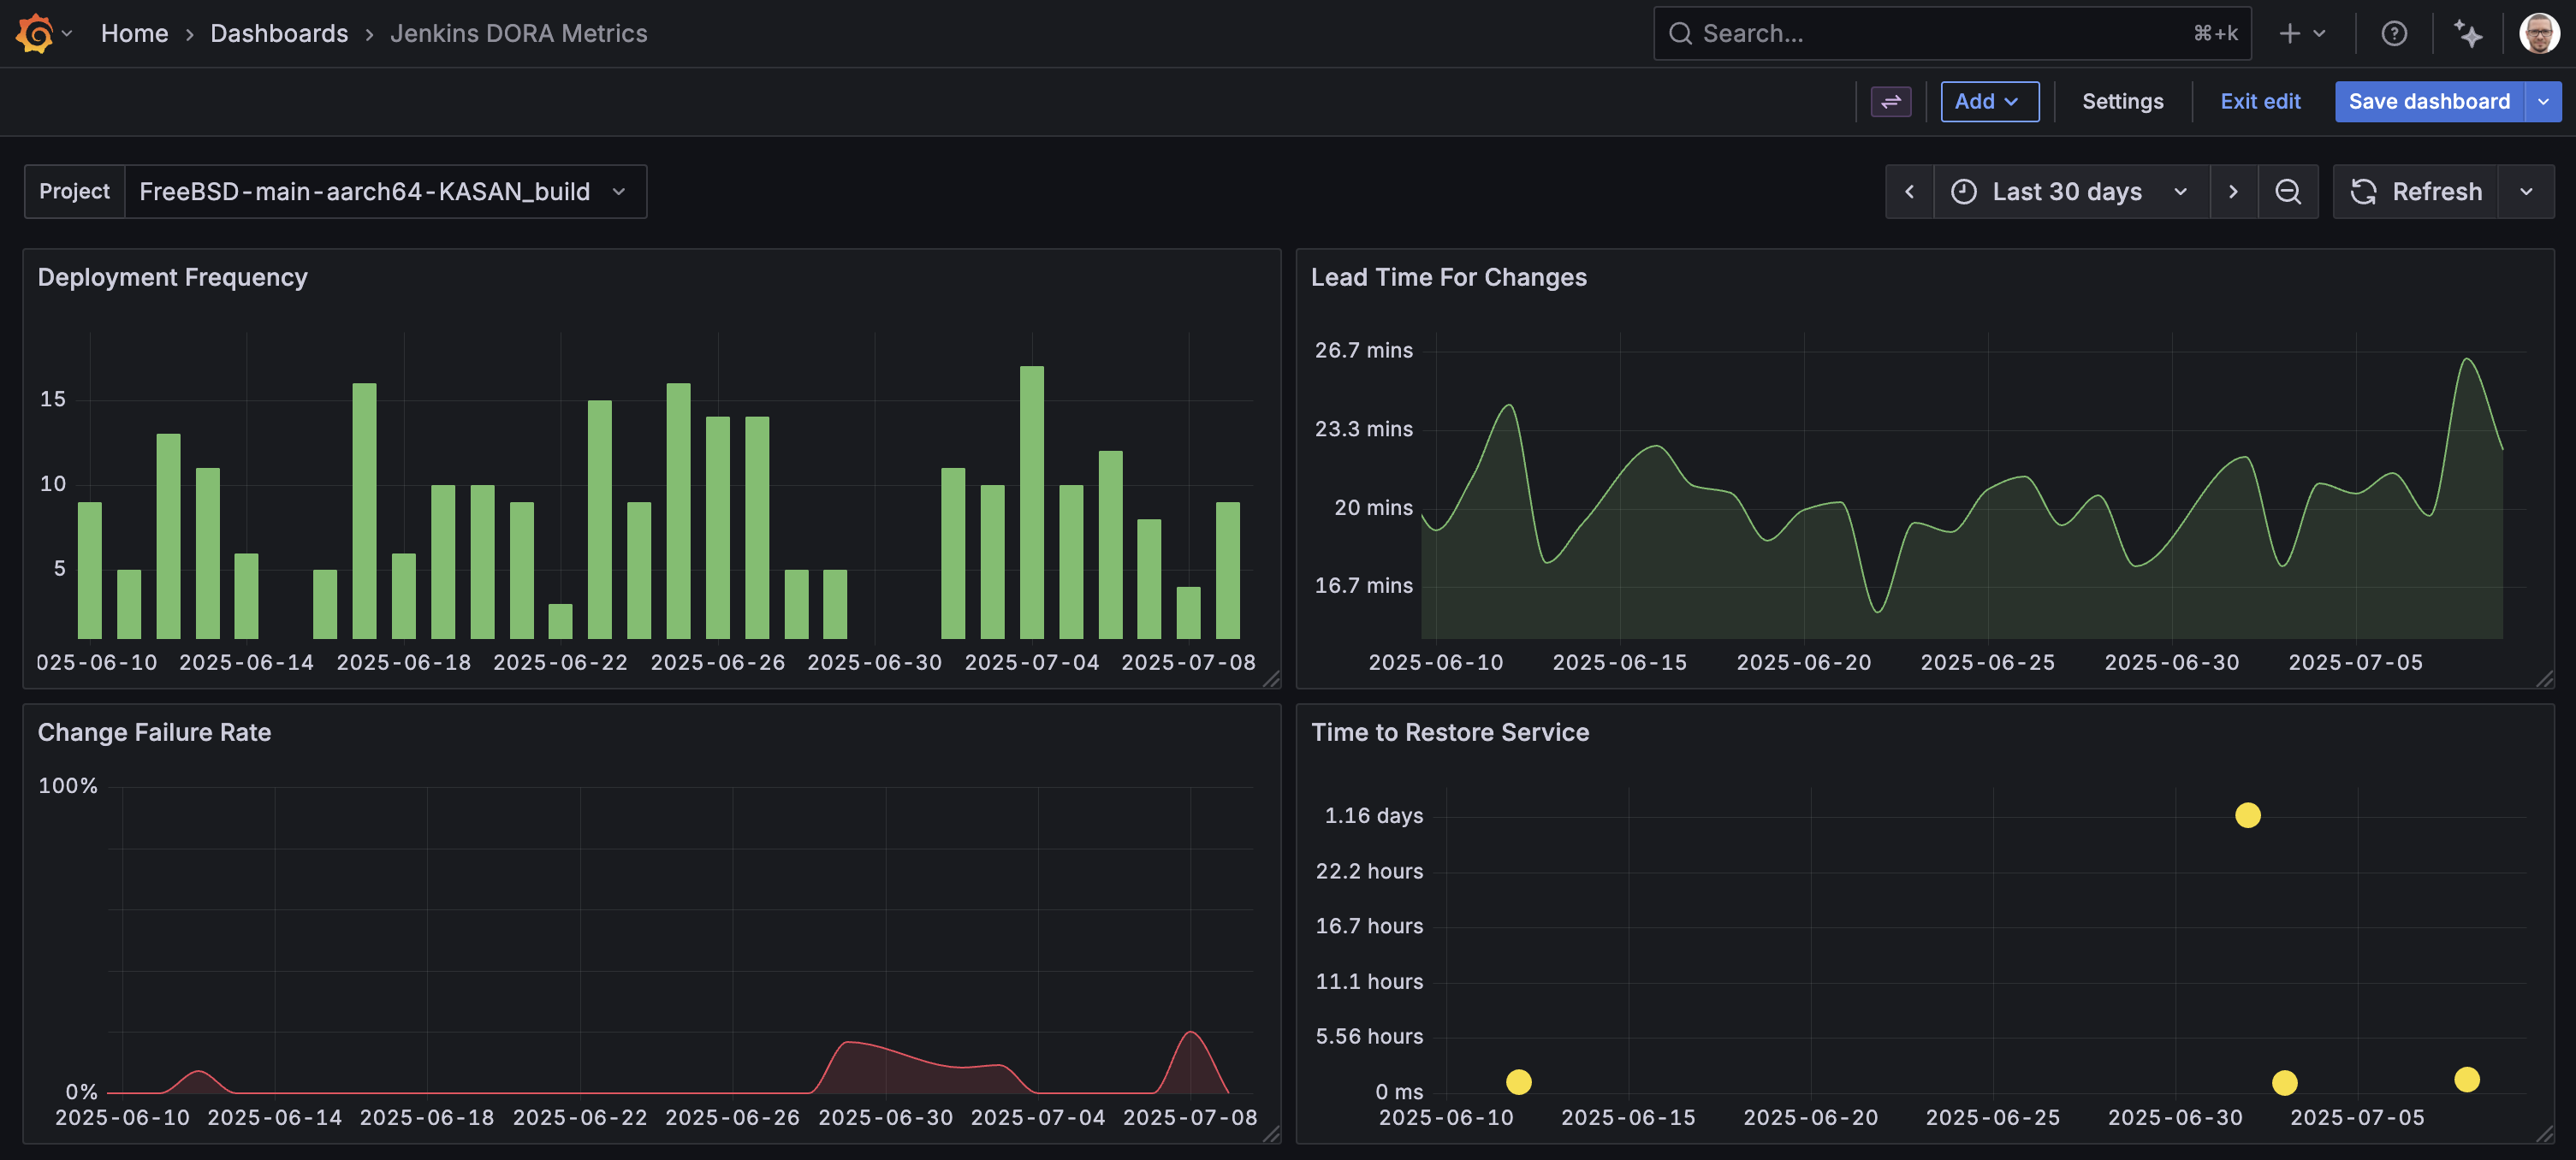
Jenkins DORA Metrics
This dashboard provides information on four key metrics used to assess software development team performance: deployment frequency, lead time for changes, change failure rate, and time to restore service. These metrics focus on both the speed and stability of software delivery.
Plugin updates
Always ensure that your plugin version is up-to-date so you have access to all current features and improvements. Navigate to Plugins and data > Plugins to check for updates. Grafana recommends upgrading to the latest Grafana version, and this applies to plugins as well.
Note
On Grafana Cloud, the Jenkins plugin is managed by Grafana and updates automatically. On self-managed Grafana, you must update Enterprise plugins manually. Refer to Version and upgrade guidance.
Learn more
- Add Annotations.
- Configure and use Templates and variables.
- Add Transformations.
- Use Explore to query data without building a dashboard.
Was this page helpful?
Related resources from Grafana Labs


