

AWS IoT SiteWise query editor
This document explains how to use the AWS IoT SiteWise query editor. The query editor supports a visual builder for the AWS IoT SiteWise APIs, an SQL clause builder, and a raw SQL code editor.
For general information about the Grafana query editor, refer to Query and transform data.
Before you begin
Before you build a query, ensure you have:
- Configured the AWS IoT SiteWise data source.
- Verified that your credentials have read access to the AWS IoT SiteWise assets and properties that you want to query.
Key concepts
If you’re new to AWS IoT SiteWise, these terms are used throughout the query editor.
Editor modes
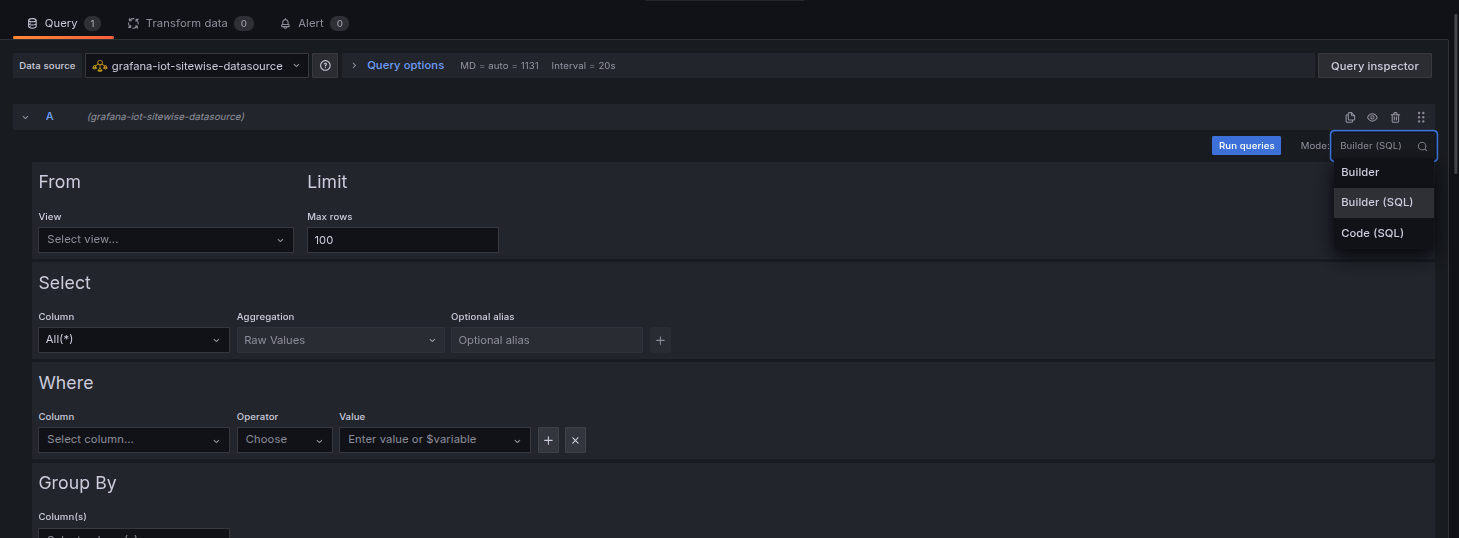
Use the mode selector to switch between the three ways to build a query.
The Builder (SQL) and Code (SQL) modes both run an AWS IoT SiteWise ExecuteQuery request and disable the client cache.

Query types
In Builder mode, select one of the following query types.
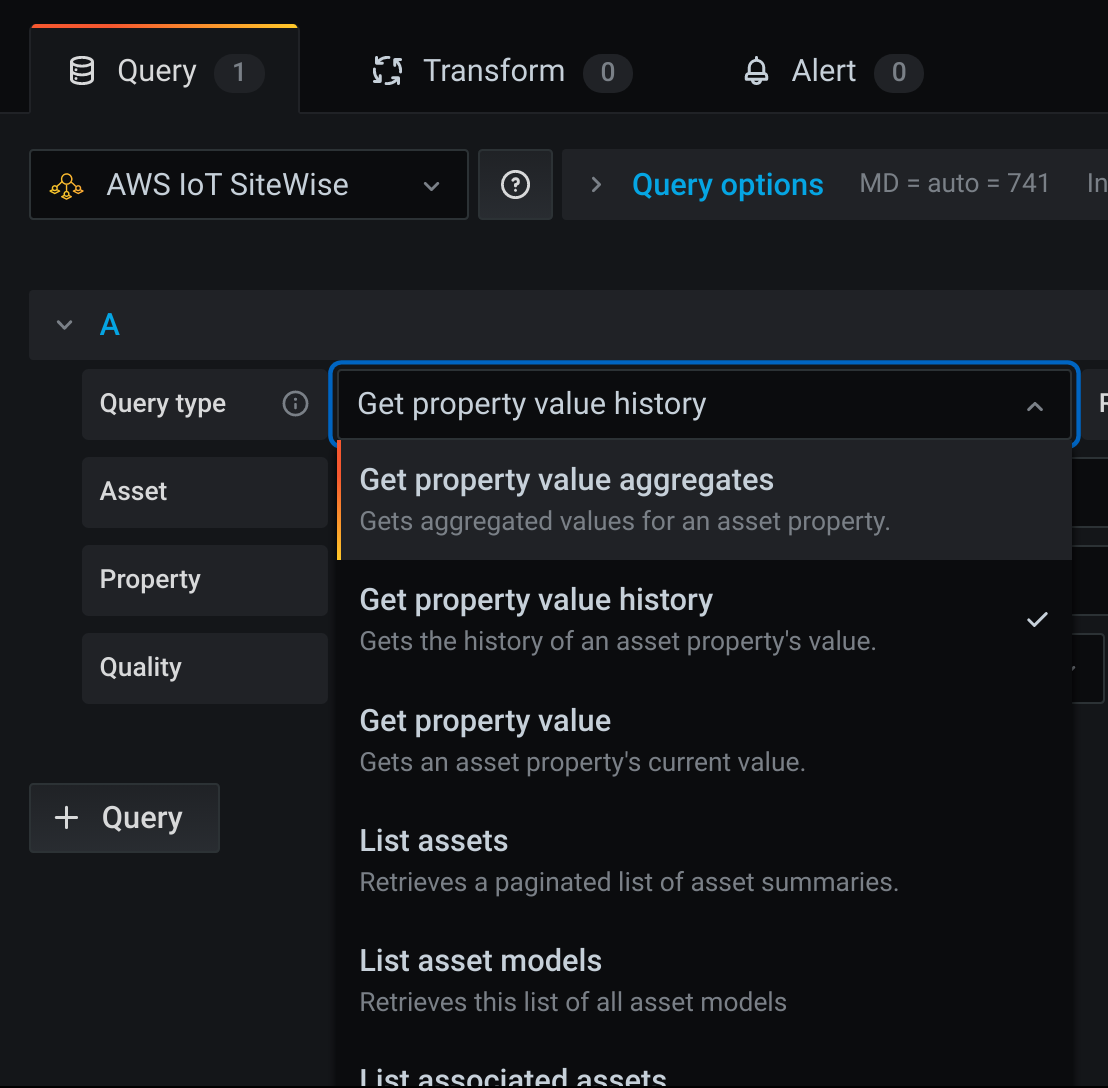
Build a visual query
To build a query in Builder mode:
- Select the AWS IoT SiteWise data source.
- Select a Query type.
- Select a Region, or use Default to use the data source’s default Region.
- Select the assets and properties, or enter a property alias.
- Set any query-specific options, such as aggregates or resolution.
Select assets and properties
Property queries need either an asset and property, or a property alias.
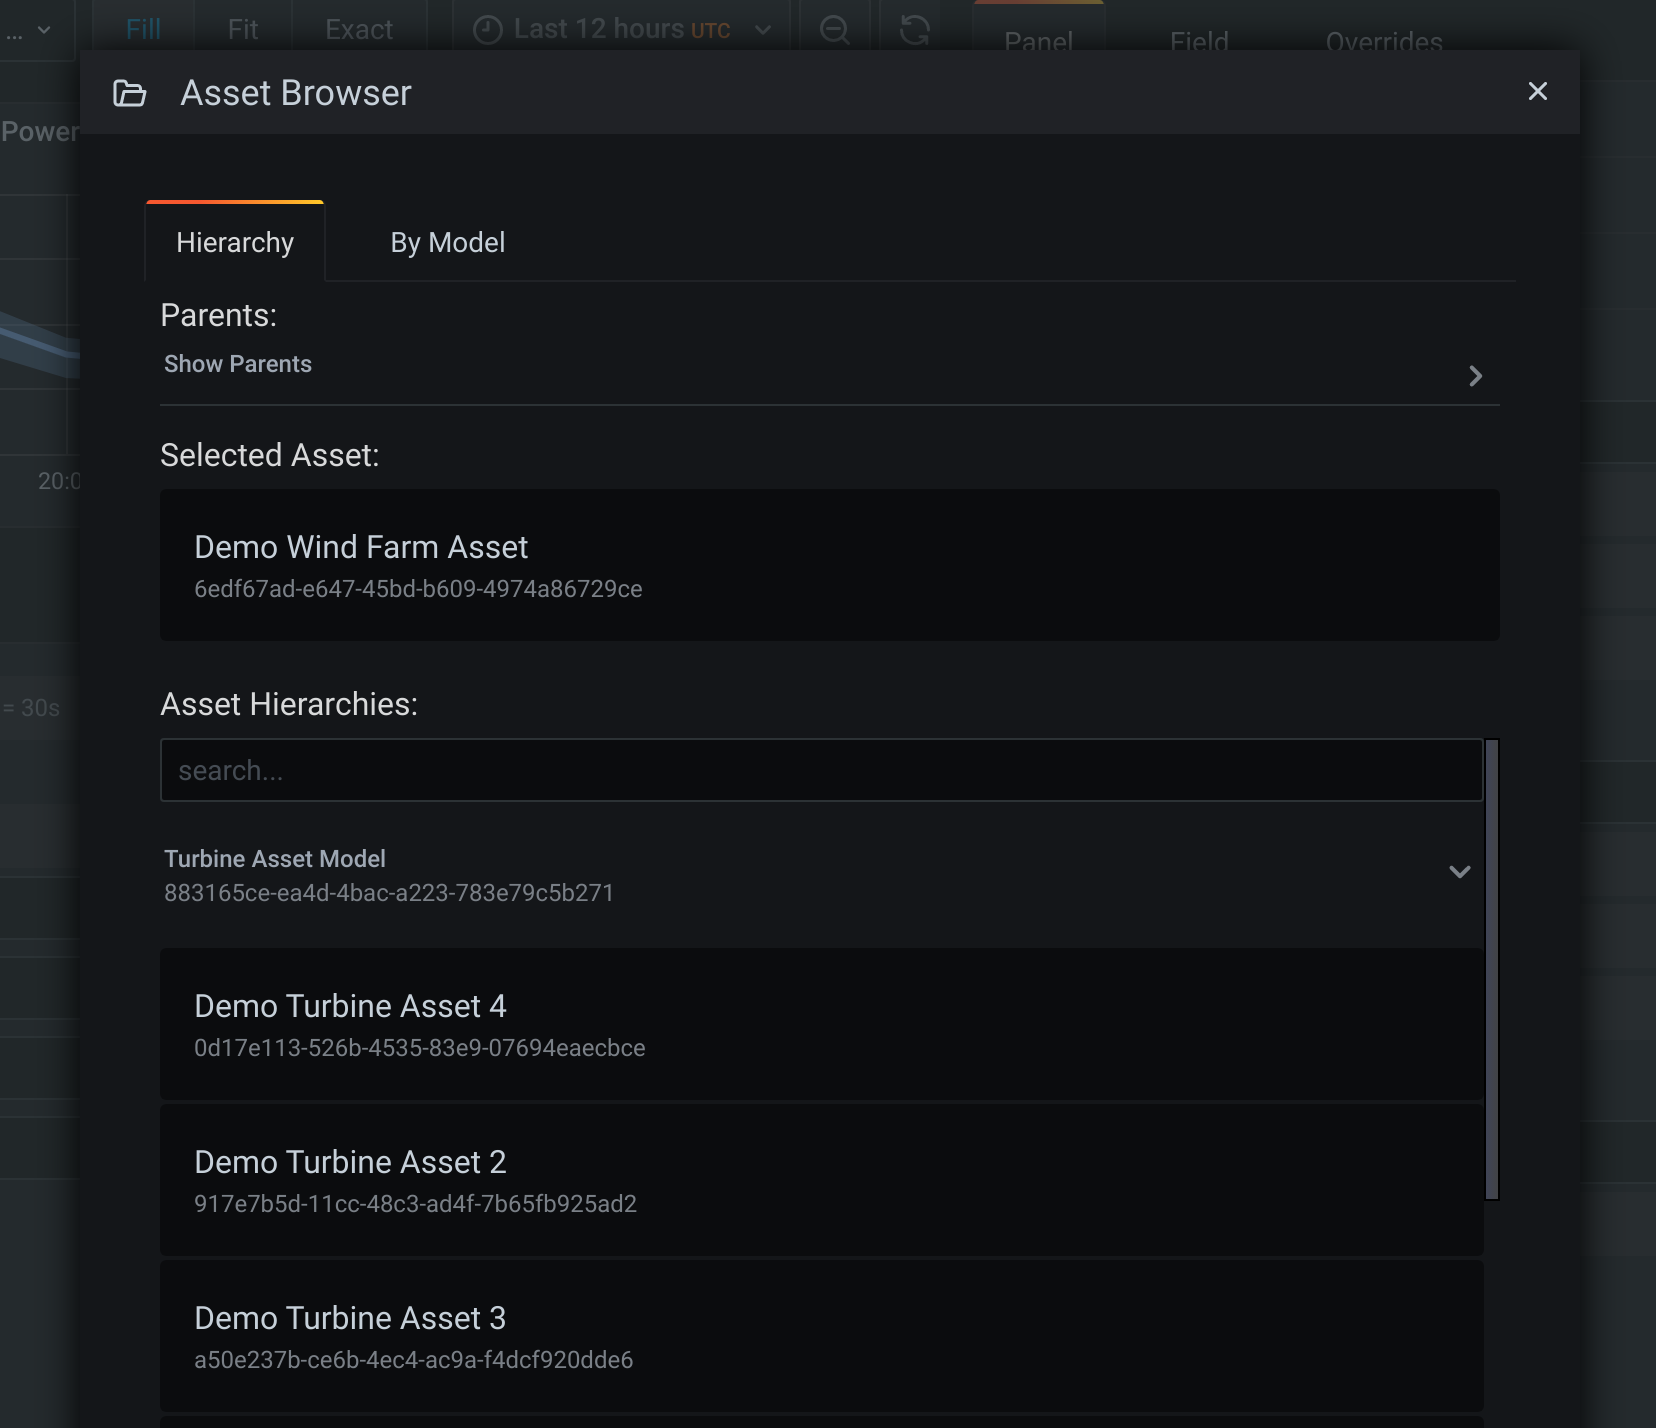
Click Explore to open the Asset Browser and navigate assets visually.
Set aggregates
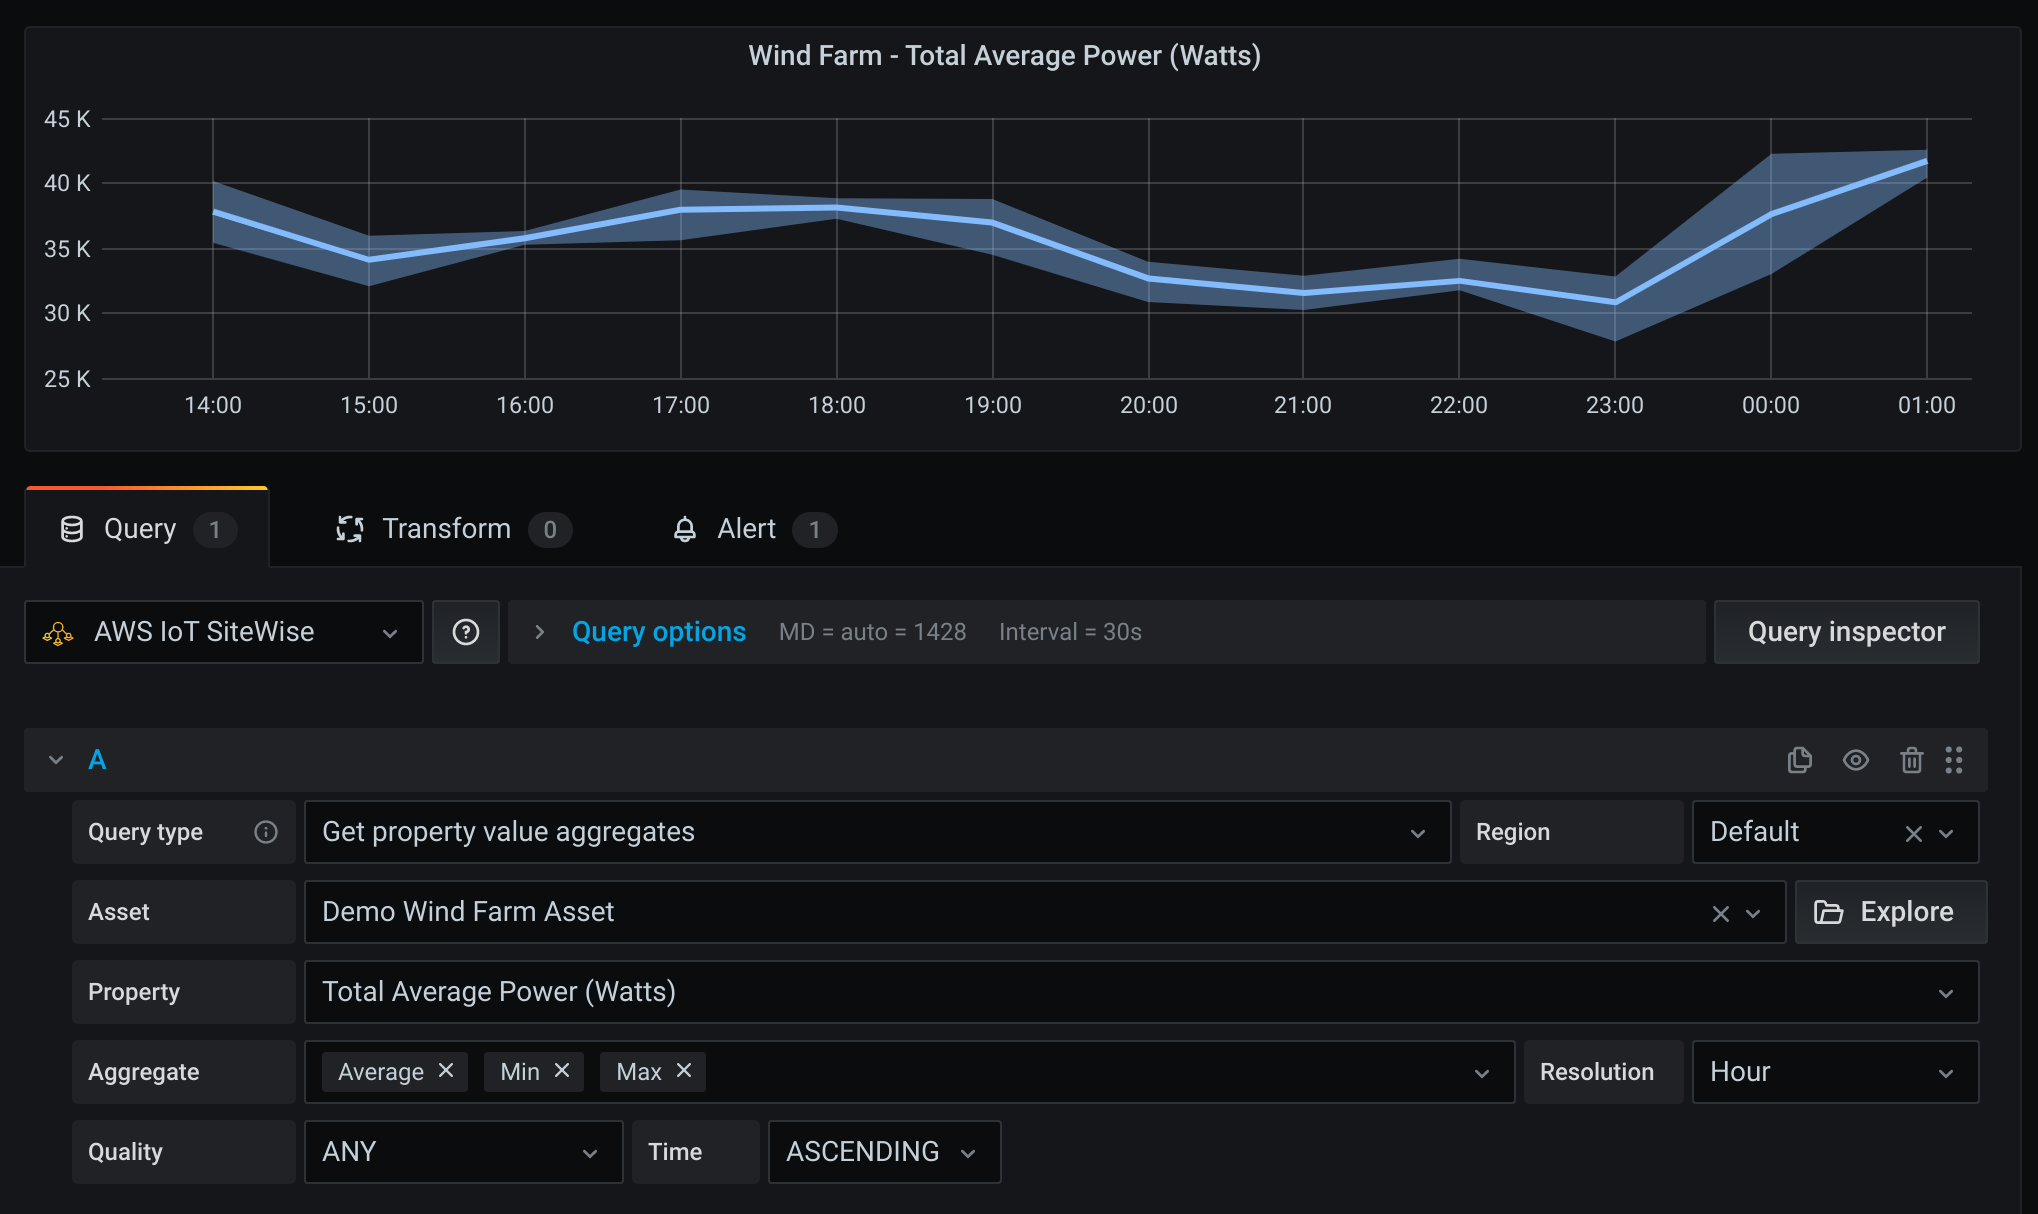
For the Get property value aggregates query type, select one or more aggregate functions. You can display multiple aggregates for a single property.
Set the resolution
For aggregate and interpolated queries, select a Resolution to control the interval that AWS IoT SiteWise uses to compute values. Aggregate queries offer the following resolutions. Interpolated queries offer additional finer resolutions, such as Second and 10 Seconds.
Resolution options also accept template variables.
Set query options
Use the Query options section to refine the results.
Query-specific fields
Some query types have additional fields.
Explore assets with the Asset Browser
The Asset Browser helps you find assets and properties without knowing their IDs. Click Explore next to the Asset field to open it.
The browser has two tabs.
- Hierarchy: Navigate the asset tree. View parent assets, the selected asset, and child hierarchies, and search within each hierarchy.
- By Model: Select an asset model, then search and select from the assets that use that model.
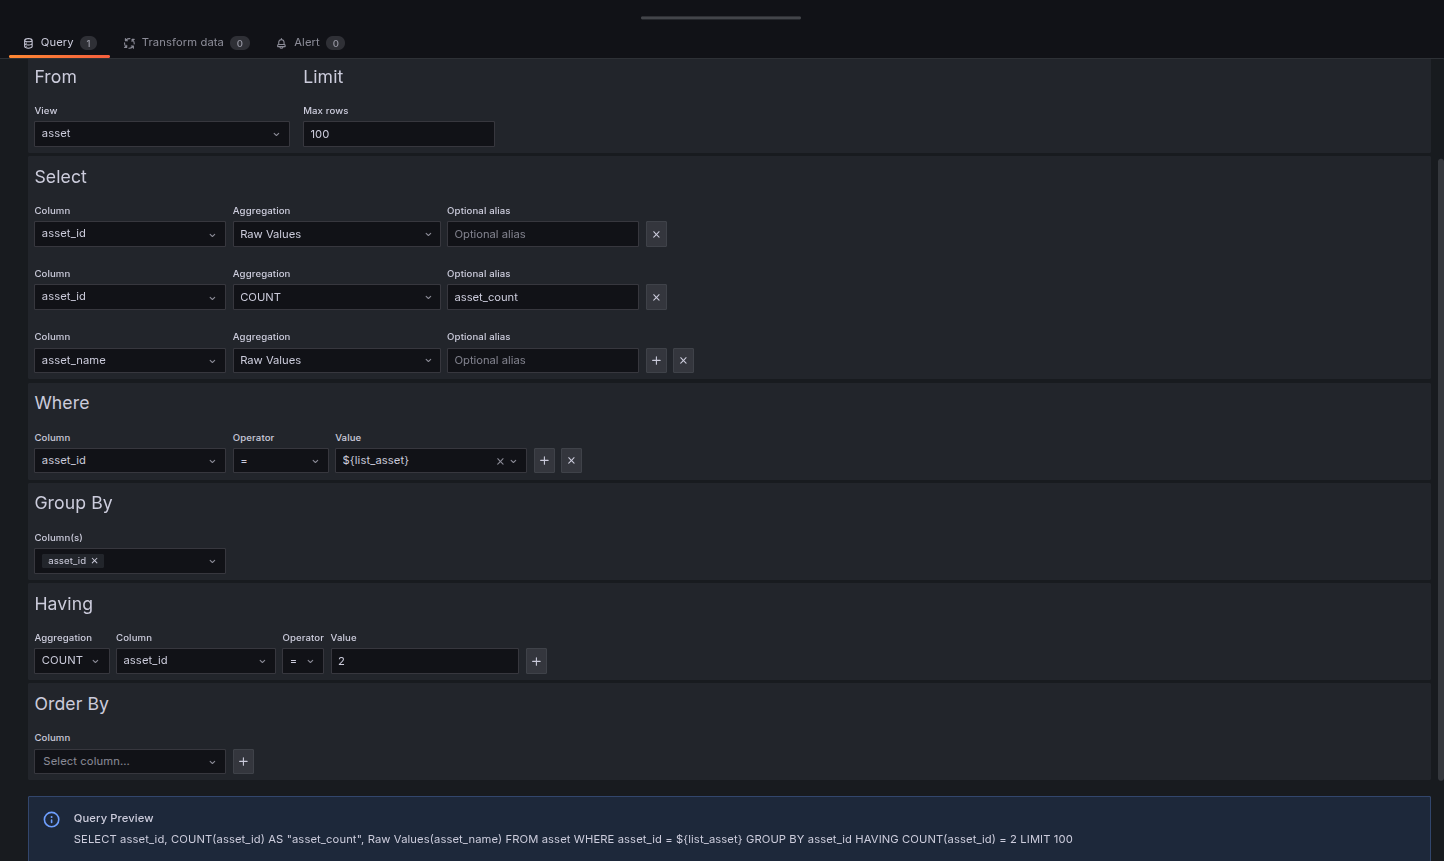
Build an SQL query
AWS IoT SiteWise supports an SQL dialect through the ExecuteQuery API. Use Builder (SQL) mode to construct a query clause by clause, or Code (SQL) mode to write raw SQL.
SQL builder clauses
In Builder (SQL) mode, construct the query with the following clauses. A query must include at least a SELECT and a FROM clause to be valid. A preview of the generated SQL appears as you build the query.
Available views
The FROM clause supports the following AWS IoT SiteWise views.
Write raw SQL
In Code (SQL) mode, write the query directly. The editor provides autocompletion for views, columns, macros, and template variables. Select the AWS Region from the editor header.
The default query is:
select $__selectAll from raw_time_series where $__timeFilter(event_timestamp)Macros
Use macros in SQL queries to reference the dashboard time range and other dynamic values. Grafana replaces each macro before sending the query to AWS IoT SiteWise.
Format Amazon Lookout for Equipment results
AWS IoT SiteWise can store Amazon Lookout for Equipment (L4E) anomaly detection results as a composite model property named AWS/L4E_ANOMALY_RESULT. When you enable Format L4E Anomaly Result on a Get property value or Get property value history query, Grafana replaces the original JSON with a frame that contains:
time: The timestamp of the prediction.quality: The quality of the value.anomaly_score: The anomaly score for the prediction.prediction_reason: The reason for the prediction.- A diagnostic contribution field for each property that contributes to the anomaly.
Inspect query metadata
For Get property value aggregates queries, the data source attaches metadata to the results. To view it, open the panel inspector and select the metadata view. The inspector shows:
- Resolution: The resolution used for the query, such as
1h. - Aggregates: The aggregate functions returned, such as
AVERAGEorMAXIMUM.
Query examples
Use the following examples as starting points. The SQL examples use the views described in Available views.
Chart aggregated values with the visual builder
To chart the hourly average of an asset property:
- Set Query type to Get property value aggregates.
- Select the Asset and Property, or enter a Property Alias.
- Set Aggregate to Average and Resolution to Hour.
- Set Format to Time series.
Return raw property values
Return the raw values for a property over the dashboard time range:
select event_timestamp, double_value
from raw_time_series
where $__timeFilter(event_timestamp)
order by event_timestamp asc
Return raw values for a specific asset
Filter the raw values to a single asset:
select event_timestamp, double_value
from raw_time_series
where asset_id = '<YOUR_ASSET_ID>' and $__timeFilter(event_timestamp)
order by event_timestamp asc
Return the most recent value for each property
select property_alias, event_timestamp, double_value
from latest_value_time_series
order by property_alias
Return aggregates with automatic resolution
Use the $__autoResolution() macro to match the resolution to the panel interval:
select event_timestamp, average_value
from precomputed_aggregates
where resolution = '$__autoResolution()' and $__timeFilter(event_timestamp)
order by event_timestamp asc
List the assets that use an asset model
select asset_id, asset_name
from asset
where asset_model_id = '<YOUR_ASSET_MODEL_ID>'
Use cases
The query editor supports a range of industrial monitoring scenarios, for example:
- Equipment monitoring: Visualize property values, such as temperature or pressure, across a fleet of assets.
- Aggregated trends: Chart averages, maximums, and standard deviations over time to spot performance changes.
- Anomaly detection: Surface Amazon Lookout for Equipment anomaly scores alongside the properties that contribute to them.
Next steps
Was this page helpful?
Related resources from Grafana Labs


