
Important: This documentation is about an older version. It's relevant only to the release noted, many of the features and functions have been updated or replaced. Please view the current version.
Dynatrace data source for Grafana
The Dynatrace data source plugin allows you to query and visualize Dynatrace metrics from within Grafana.
Requirements
This plugin has the following requirements:
- A Dynatrace account
- One of the following account types:
- Grafana Cloud: Pro customers, Advanced customers, or Pro trial users with the Enterprise plugin add-on enabled
- Grafana Enterprise: Customers with an activated license and a user with Grafana server or organization administration permissions
- The Enterprise plugin add-on enabled
Known limitations
- Template variables cannot be multi-select; only single selection is supported.
- Only v2 metric APIs are supported.
Install the Dynatrace data source plugin
To install the data source, refer to Installation.
Get an API key from Dynatrace
To set up an API token, refer to Dynatrace API - Tokens and authentication.
Set the metrics.read and entities.read permissions for your API token.
Configure the data source in Grafana
Add a data source by filling in the following fields:
- Name
- A name for this particular Dynatrace data source.
- Dynatrace API Type
- Select
SaaSorManaged Clusterdepending on the instance type you are connecting to. - Environment ID
- The first portion of the URL after logging in. e.g.
yfc55578.live.dynatrace.com, your environment ID would beyfc55578. - Dynatrace API token
- An API token generated with
metrics.readandentities.readpermissions. Refer to Get an API key and application key from Dynatrace. - Skip TLS verify
- optional Enable this option if you required to skip TLS verification. Default value: false
- With CA Cert
- optional Needed for verifying self-signed TLS Certs Default value: false. If enabled, you also need to provide the corresponding certificate in CA Cert section
Configure the data source with provisioning
It is possible to configure data sources using config files with Grafana’s provisioning system. To read more about how configuration works, including all the settings that you can set for data sources, refer to Provisioning Grafana.
apiVersion: 1
datasources:
  - name: Dynatrace
    type: grafana-dynatrace-datasource
    access: proxy
    editable: true
    enabled: true
    jsonData:
      apiType: <api type>
      environmentId: <environment id>
    secureJsonData:
      apiToken: API token
version: 1| API Type | Description | Valid values for environmentId |
|---|---|---|
| sass | Use sass if you are accessing dynatrace as a cloud service | This is the <environmentId>.live.dynatrace.com part of the URL |
| managed | Use managed if you are accessing dynatrace on-prem | This is the host name of your on-prem dynatrace instance (ex: my-dynatrace-host.company.com) |
| url | Use url if neither of the options above apply | Enter the full url of your dynatrace instance https://my.dynatrace-instance.com |
apiVersion: 1
datasources:
  - name: Dynatrace
    type: grafana-dynatrace-datasource
    access: proxy
    editable: true
    enabled: true
    jsonData:
      apiType: managed
      environmentId: <hostname>
      domain: <domain>
      tlsSkipVerify: false
      tlsAuthWithCACert: true
    secureJsonData:
      apiToken: API token
      tlsCACert: |
        -----BEGIN CERTIFICATE-----
        1221323123213123231231232+g6DAzj/11231
        sdsaas==
        -----END CERTIFICATE-----
    version: 1
In the esample above for a managed on-prem installation, the url to your dynatrace instance will look like https://<hostname>/e/<domain>/api/
Query the data source
The query editor allows you to query Dynatrace metrics and problems.
Query
The query type can be on of the following:
MetricProblemsUSQLDirect API Access
Metric query type
- Metric
- Select the metric that you want to see. To get the metric list from Dynatrace again, click the Refresh button.
- Aggregations
- Select the aggregation you want to use for a specific metric. Click the aggregations value to change the aggregation type or click the + button to add another aggregation.
- Transformations
- You can select transformations in the query editor. Afterwards, enter a number of parameters into the selected transformation. Currently, only the merge transformation is supported. For information about the merge transforms, refer to Merge transformation.
- Filters
- The Dynatrace plugin dynamically queries the appropriate filters for each metric.
- To add a filter, click the + symbol next to the
Filterslabel on the Dynatrace query editor, select which field you would like to filter on, select the operator you would like to use, and then select a value to filter by. - The Dynatrace plugin allows you to create
Filter Groupsthat you can join together to create complex logical comparisons. For most use cases,Filter Groupsare not required. - When creating filters with
Tags, regardless of the conjunction selected, Dynatrace will always useAND. Dynatrace does not supportORfilters withTags. - Alias
- There are two different types of aliases you will encounter while using the Dynatrace plugin. The first is a
static alias. An alias of this type is available on every query that you build, and the name of the alias starts with a lowercase letter. The second is adynamic alias, which changes based on the metric that you are using in your query, and the name of the alias starts with an uppercase letter. - The Dynatrace plugin supports several different aliases:
Metric Names,Aggregation,Display Name,Host, andDescription.
| Name | Value |
|---|---|
| $name | builtin:apps.other.keyUserActions.reportedErrorCount.os |
| $aggregation | auto,value |
| $displayName | Reported error count (by key user action, OS) [mobile, custom] |
Problems query type
- Problem Query Type
- Select a problem query type. Currently, only the feed problem query type is supported. For information about the feed problem query type, refer to Problems API - GET feed.
- Status Filter
- Filter the result problems by the status.
- Impact Filter
- Filter the result problems by the impact level.
- Severity Filter
- Filter the result problems by the severity level.
- Expand Details
- Include related events to the response, if set.
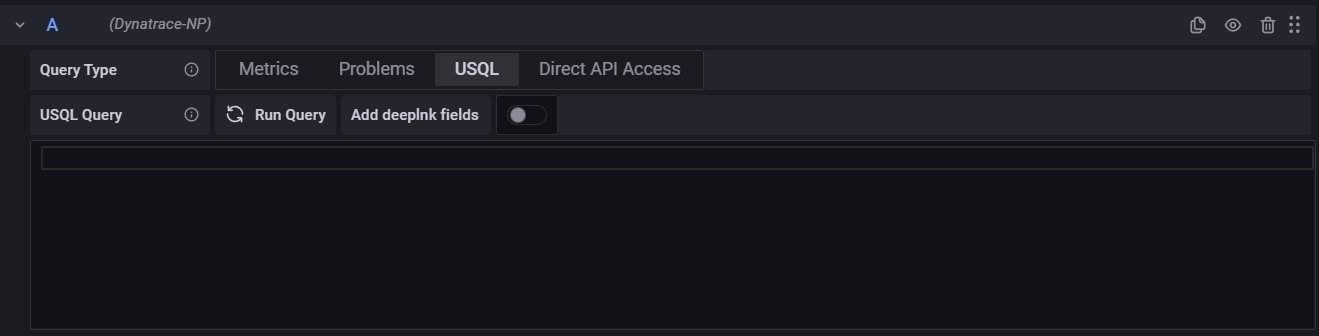
USQL Query Type
![image]()
- Add deeplink fields
- Add additional deep linked fields into the query
- Run Query
- Click to run the query. This will have the same effect as clicking refresh
- USQL Query
- Enter your USQL query in the editor below. Note that hitting Alt+S/Cmd+S will also save and run the query.
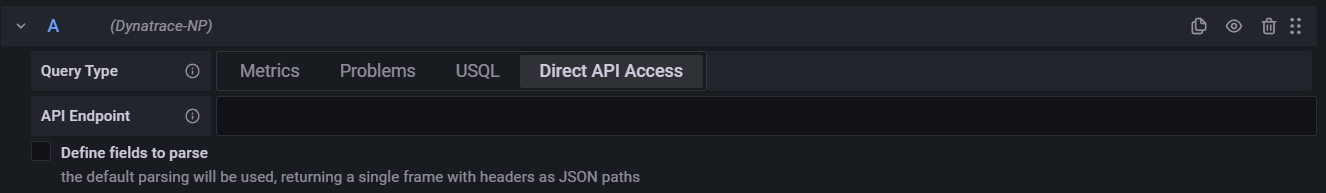
Direct API Access Query Type
![image]()
- API Endpoint
- Refers to the portion of the URL that starts with the version of the API call you wish to make. (ex:
v1/timeseriesorv2/metrics) - Define fields to parse
- Unselected (default): Use the standard parsing, which is to return every field as it’s own column. The column name refers to the JSON Path to the associated data in the column.
- Selected: Define a custom parsing method, as outlined below.
Define a custom parsing method
- Field
- The JSON Path to the data to reference
- Type
- The type assigned to the data. Timestamp fields are not autodetected, and must be specifically typed to be parsed as a timestamp.
- Alias
- Use the text entered as the data column title, rather than the default title
Templates and variables
To add a new Dynatrace query variable, refer to Add a query variable. Use your Dynatrace data source as your data source for the following available queries:
- Query type
- Select a query type. The query type associate some data with some key or descriptor.
| Query type | Description |
|---|---|
| Metric names | Returns a list of all metric names |
| Filter keys | Returns a list of all the possible dimensions (e.g. Hostname) that can be used to filter |
| Filter values for key | Returns a list of filtered values by a key name or a key name template variable |
| Problem status options | Returns a list of all problem statuses |
| Problem impact options | Returns a list of all problem impacted areas |
| Problem severity options | Returns a list of all problem severity types |
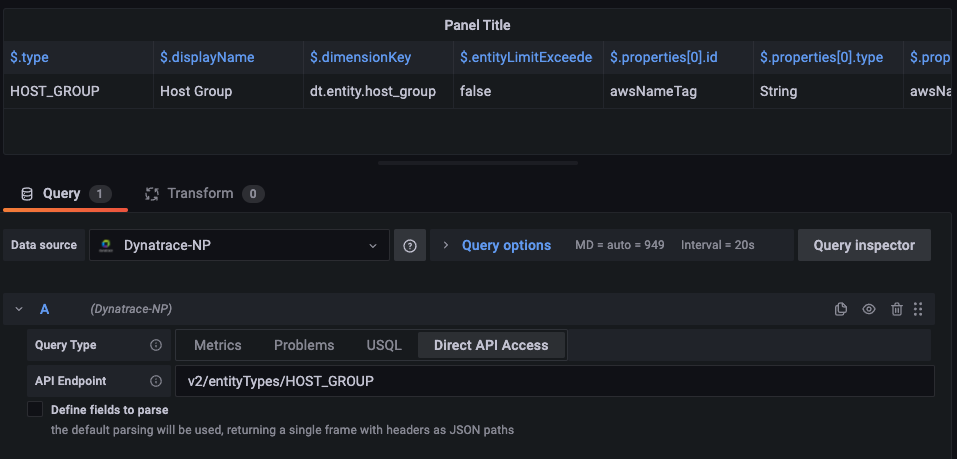
- Filter values for key
- Retrieving these values requires the display name of the associated Filter key.
Example: To retrieve values for the filter key “Host Group”, rather than using the type “HostGroup”, the expected input is the _display name which would be “Host Group”
![image]()
Generally, the display name is always the type without “_”, as in the above example. However, this is not always the case. When in doubt, use
Direct API Accessto look at the display name- Regex
- (Optional) Filter out any of the returned values from your query with a regular expression
Note: Multi-value and Include All option are currently not supported by the Dynatrace plugin.
After creating a variable, you can find it in the Metric drop-down menu. For more information about variables, refer to Templates and variables.
Import a dashboard for Dynatrace
To import a dashboard, refer to Importing a dashboard. Imported dashboards can be found in Configuration > Data Sources > select your Dynatrace data source > select the Dashboards tab to see available pre-made dashboards.
Get the most out of the plugin
- Add Annotations.
- Configure and use Templates and variables.
- Add Transformations.
- Set up alerting; refer to Alerts overview.
Was this page helpful?
Related resources from Grafana Labs


