

Configure the Databricks data source
This document describes configuration options for the Databricks data source in Grafana.
Before you begin
You must have an active Grafana Enterprise or Grafana Cloud license that includes the Databricks plugin. The Databricks data source is a Grafana Enterprise plugin, so it doesn’t work without a valid license that covers it. If your license doesn’t include the plugin or has expired, Save & test returns a generic
Plugin health check failederror. Refer to License and setup errors for help.You must have the
Organization administratorrole. Only account administrators can install the Databricks plugin and configure the data source. Organization administrators can also configure the data source with YAML using the Grafana provisioning system.You must install the Databricks plugin before adding the data source. Refer to Install and upgrade the Databricks data source plugin for installation methods across Grafana Cloud, Docker, and Kubernetes. Grafana recommends keeping your plugin up-to-date to access all current features.
Familiarize yourself with your Databricks security configuration and gather any necessary security certificates and client keys. You need this information to set up your connection.
Decide which authentication method best fits your deployment. Grafana recommends Personal Access Token or OAuth M2M for most installations.
Note
The plugin does not work with token-based authentication when run on bare Alpine Linux. If Alpine Linux is a requirement, Grafana recommends using the official Alpine images.
Configure the data source using the UI
To add the Databricks data source, complete the following steps:
- Install the Databricks plugin.
- Click Connections in the left-side menu.
- Under Connections, click Add new connection.
- Enter
Databricksin the search bar. - Select Databricks under the Data Source section.
- Click Add new data source in the upper right.
You are taken to the Settings tab where you set up your Databricks configuration. Configuration happens in three parts: connection settings, an authentication method, and optional additional configuration options.
Connection settings
These settings identify the data source and the Databricks SQL warehouse it connects to.
Authentication methods
After you set the connection details, choose an authentication method. The configuration fields displayed change according to the selected method.
The Databricks data source supports the following authentication methods. Use the comparison table to choose the method that fits your deployment, then follow the matching section for setup details.
Note
Methods that require a user context, such as OAuth Passthrough and Azure (On-Behalf-Of), can’t run alert rules because no user is present during alert evaluation. For alerting, use Personal Access Token, OAuth M2M, or Azure Entra ID M2M. Refer to Alerting for details.
Caution
Known limitations:
- Azure Managed Grafana: OAuth Passthrough and Azure (On-Behalf-Of) require editing the
grafana.iniconfiguration file, which isn’t possible in Azure Managed Grafana or other fully managed environments. Use Personal Access Token, OAuth M2M, or Azure Entra ID M2M instead.- Azure Entra ID M2M version requirement: In plugin versions earlier than 1.14.3, Azure Entra ID M2M was a preview feature gated behind the
databricksAzureM2MEntraIdAuthfeature toggle. It’s available to all instances in current versions, so upgrade the plugin if the method doesn’t appear.
Personal Access Token authentication
Personal Access Token (PAT) authentication uses a token generated in your Databricks workspace. This is the quickest method to set up and is suited to single-user or shared-credential access. For more information, refer to Manage personal access token permissions in the Databricks documentation.
Note
Databricks Community Edition workspaces don’t support Personal Access Token authentication. Use OAuth M2M with a service principal instead.
OAuth M2M authentication
OAuth machine-to-machine (M2M) authentication is service-to-service authentication with no human interaction. Grafana authenticates as a registered application (a service principal) in Databricks, so authentication is tied to an application identity rather than a user. This is more secure and easier to manage long term, and it works with Databricks on AWS, Azure, and Google Cloud.
Note
OAuth M2M authenticates against a Databricks-managed service principal. It doesn’t accept Azure Entra ID (Microsoft Entra ID) credentials. If you use an Azure AD service principal and select OAuth M2M, authentication fails with
invalid_clientorClient authentication failed. For Azure AD service principals, use Azure Entra ID M2M authentication instead.
OAuth Passthrough authentication
OAuth Passthrough authentication passes through the user’s existing OAuth credentials, so each user queries Databricks with their own identity. This method requires a user context and can’t run alert rules.
OAuth Passthrough has no additional fields on the data source settings page. Grafana forwards the signed-in user’s OAuth token automatically after you complete the server-side configuration described in this section.
If you are using OAuth Passthrough with Microsoft Entra ID (formerly Azure Active Directory), complete the following steps.
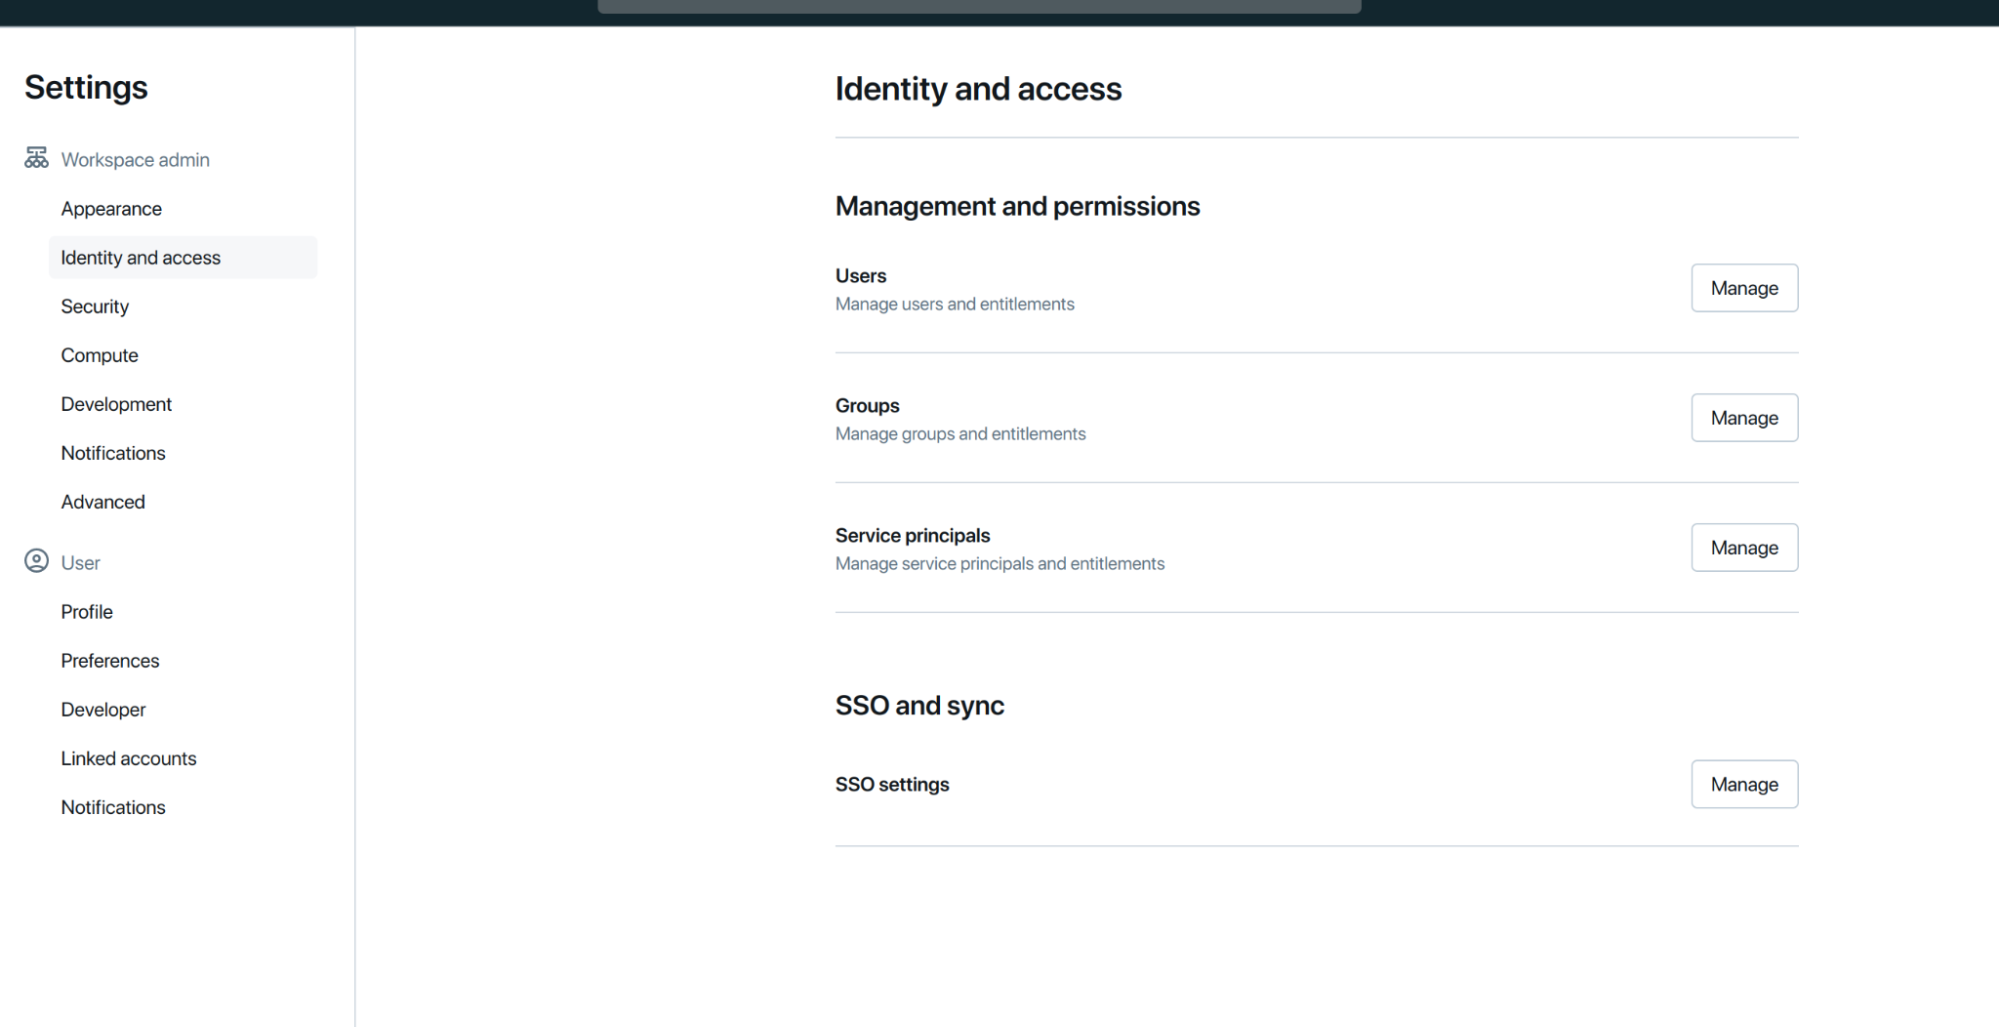
- In your Databricks workspace, navigate to Settings > Identity and access > SSO and sync > SSO Settings, then click Manage.
![Databricks dashboard]()
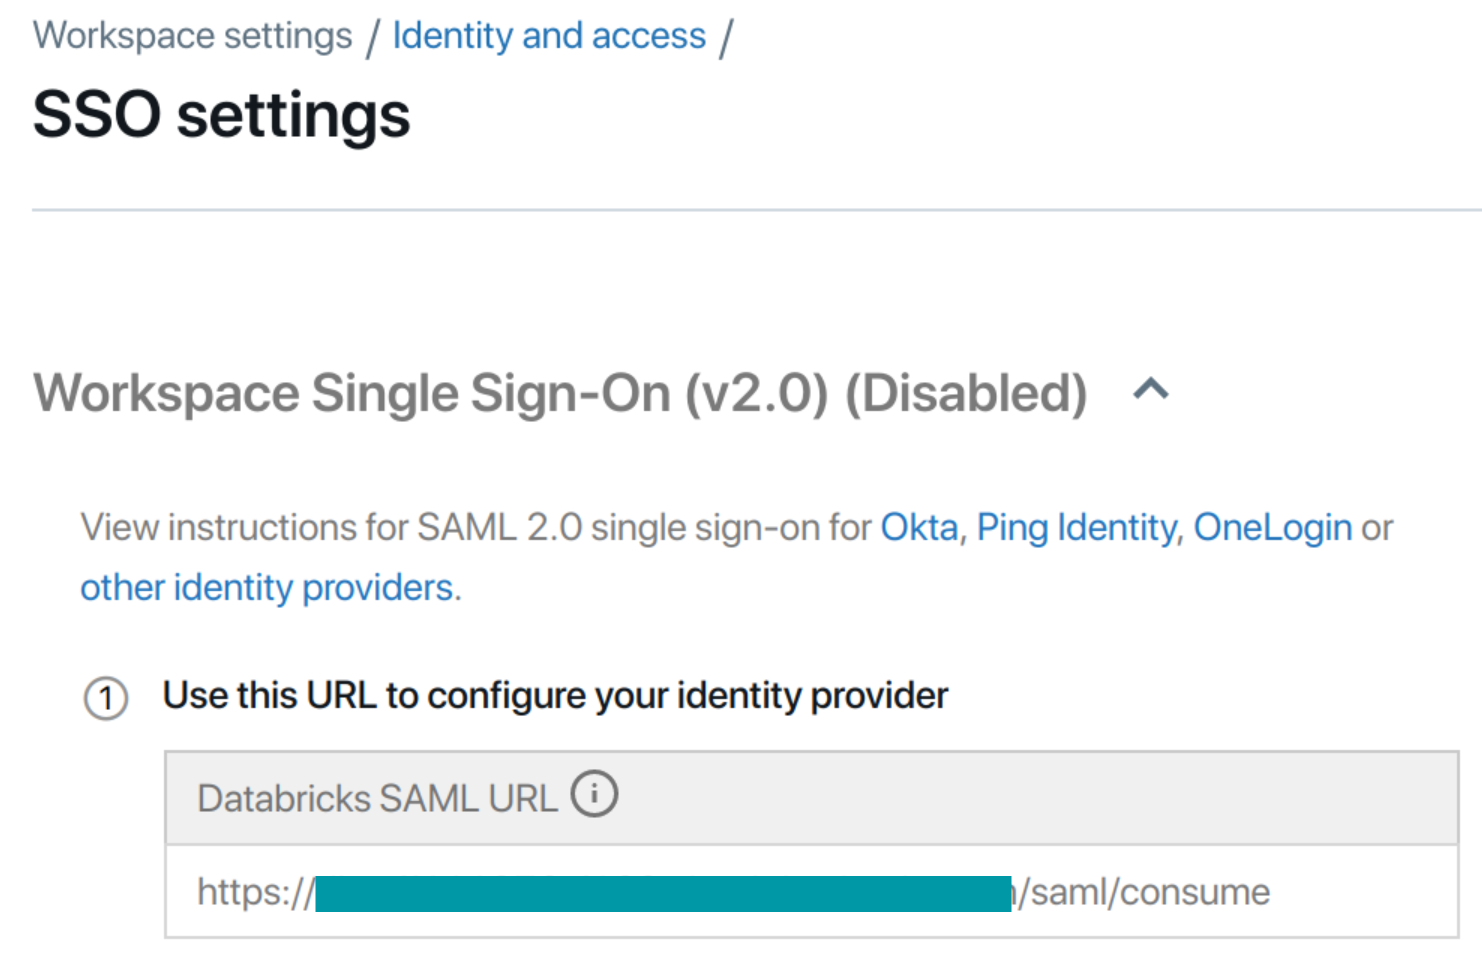
- Copy the Databricks SAML URL. Don’t close this tab.
![Databricks dashboard]()
- In a new tab, open the Azure Portal.
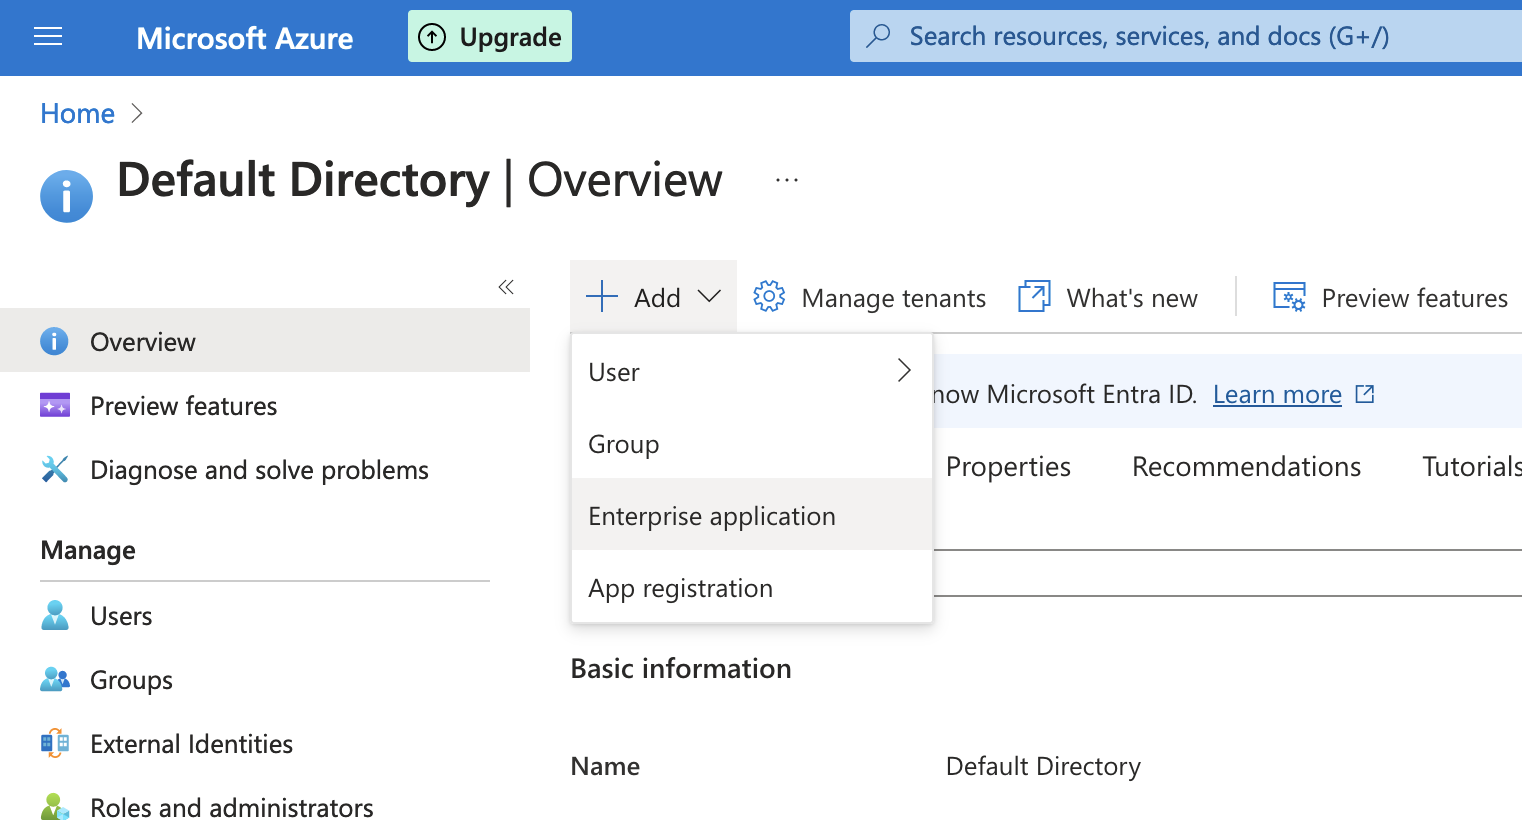
- Go to Microsoft Entra ID > Add > Enterprise Application.
![Microsoft Entra ID Add Enterprise Application screen]()
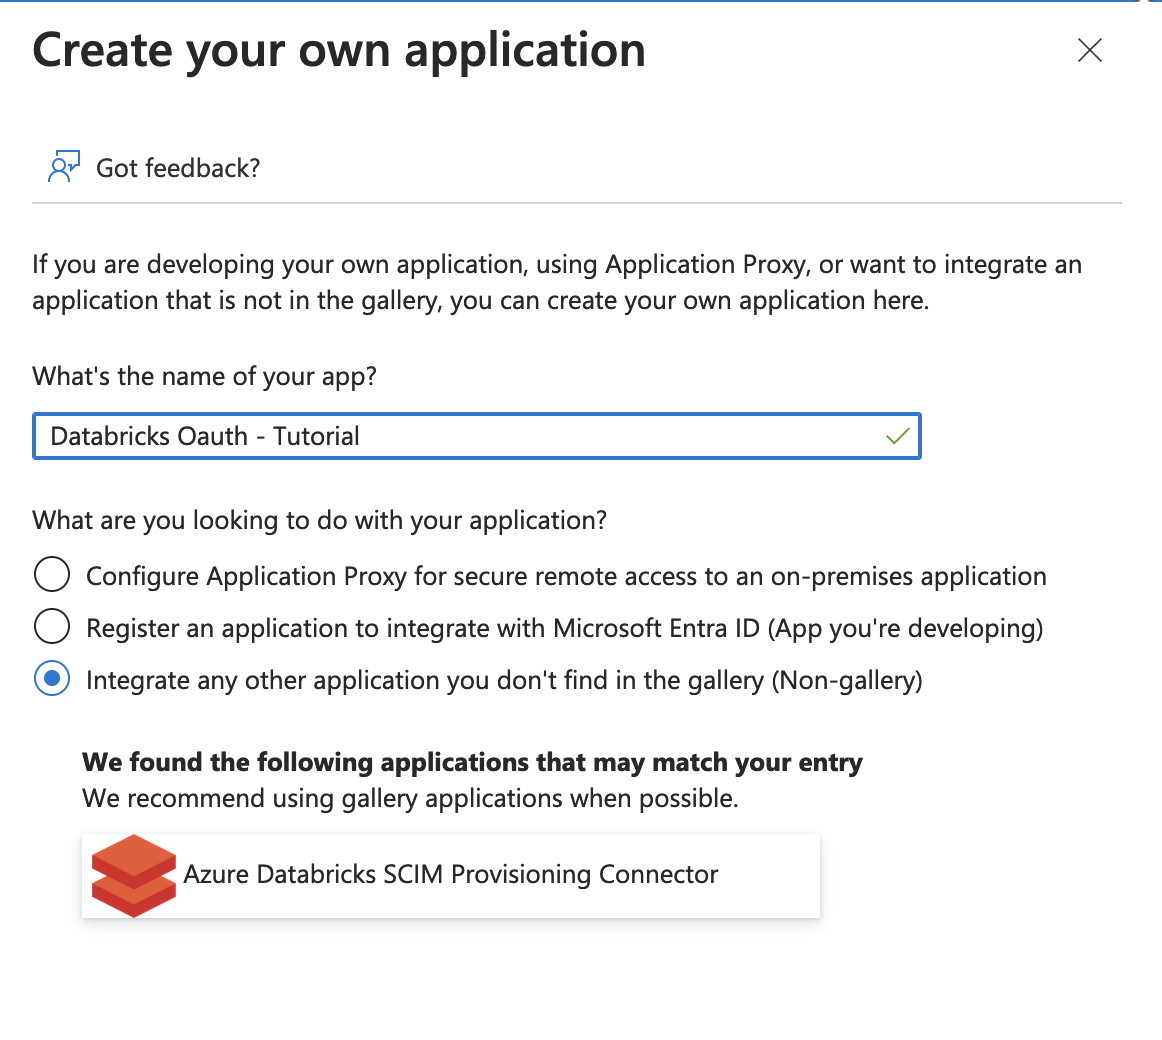
- Enter a name for the application. When prompted with “What are you looking to do with your application?”, select Integrate any other application you don’t find in the gallery.
![Databricks create application screen]()
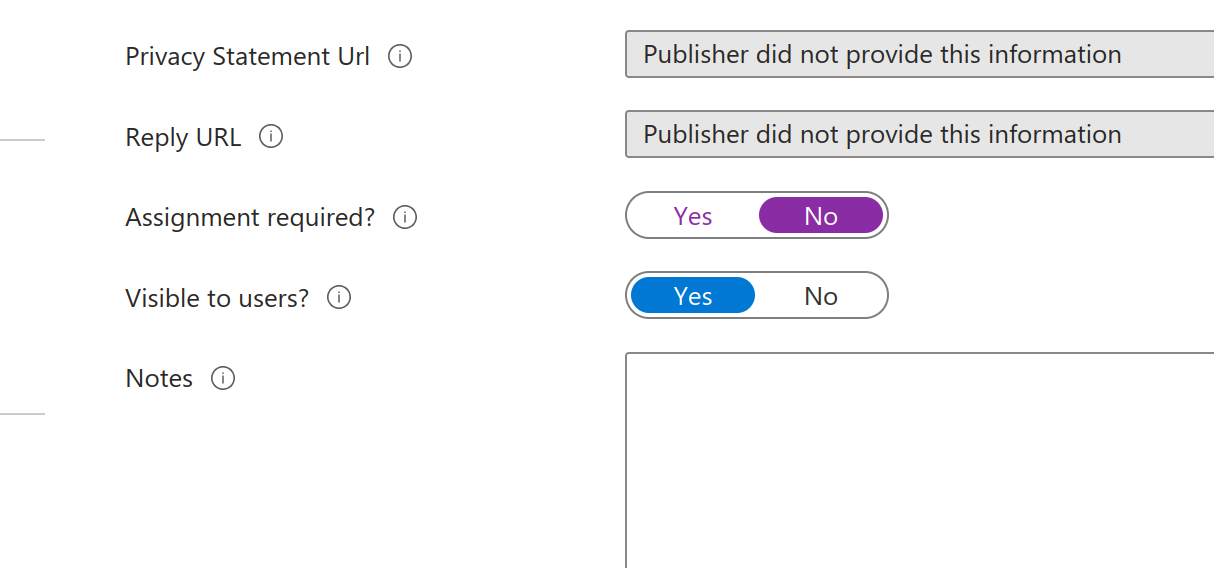
- Under Properties, set Assignment required to No.
![Databricks create application screen]()
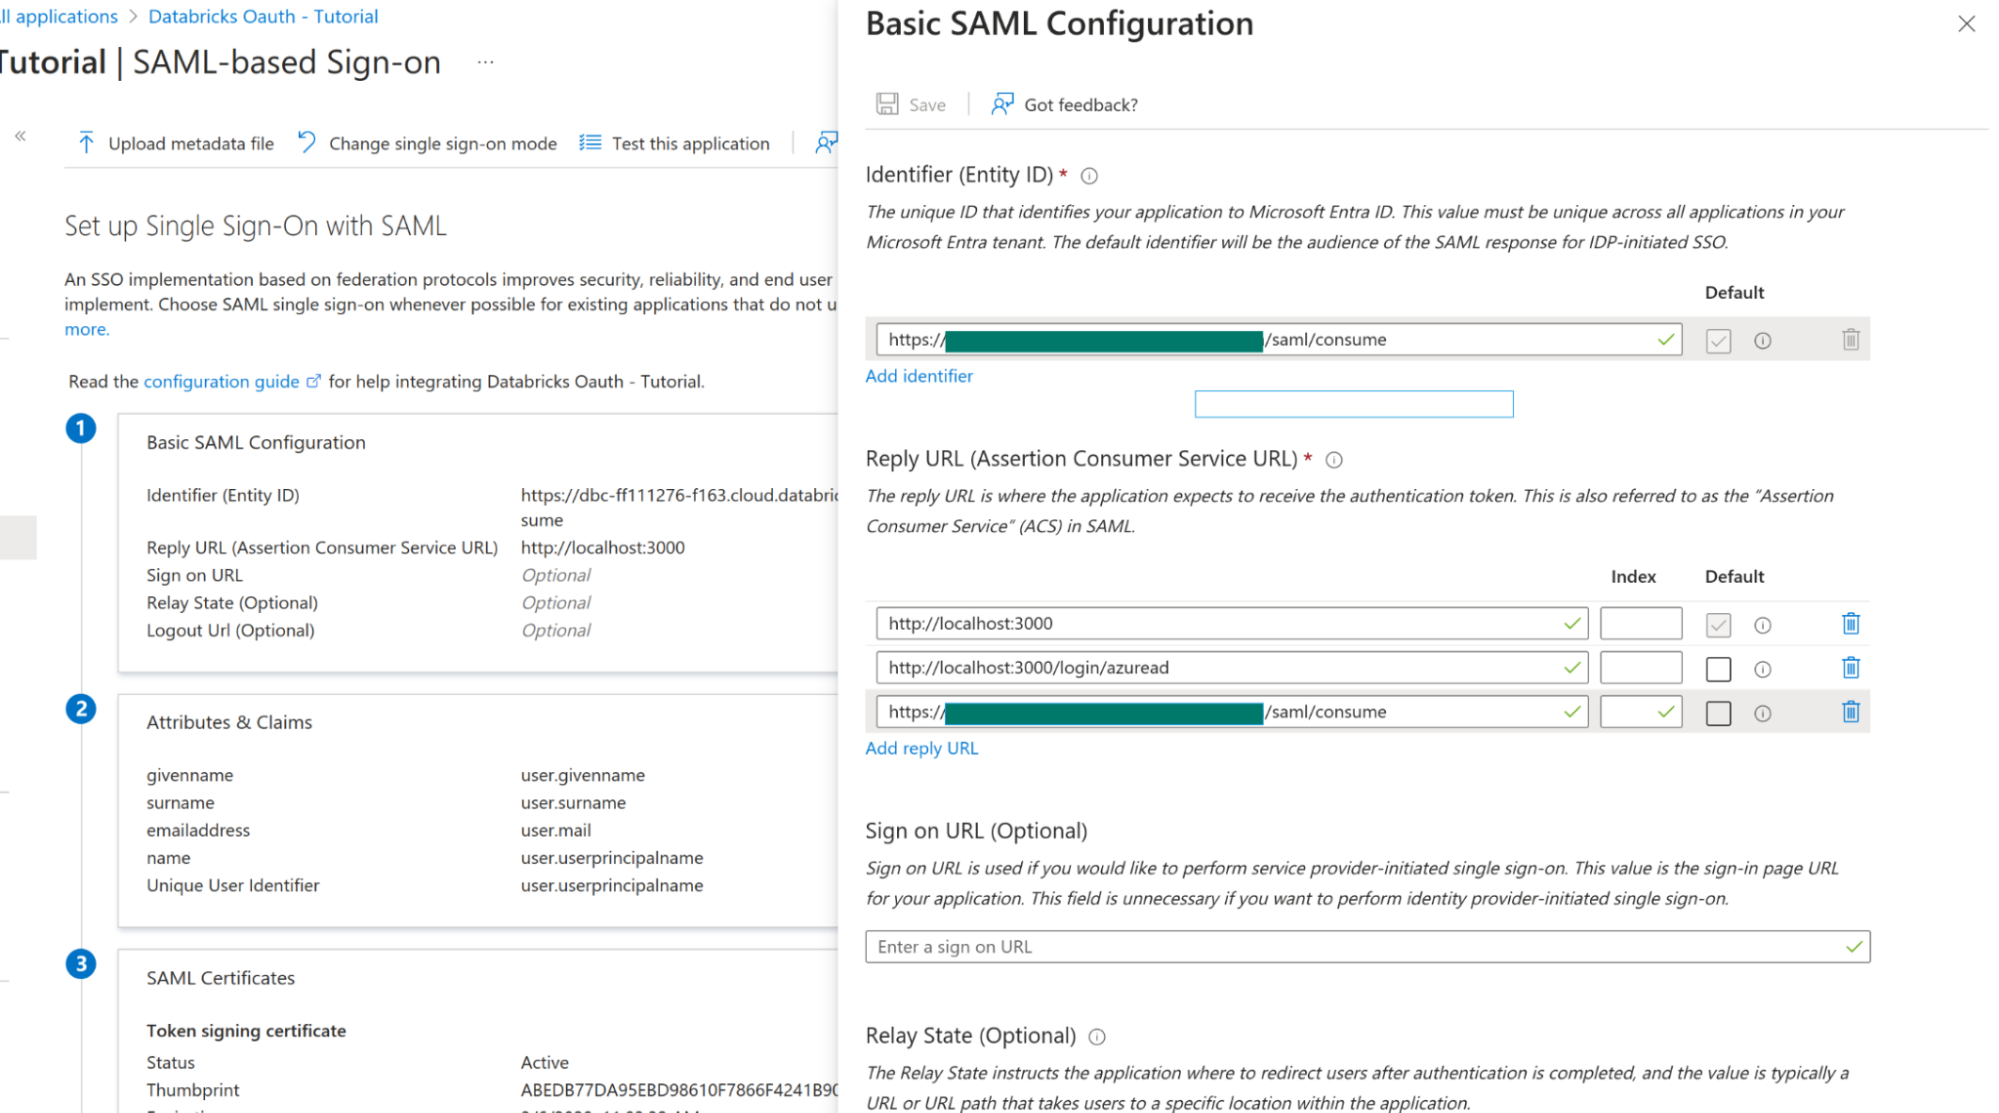
- Under Single sign-on, click SAML, then under Basic SAML Configuration, click Edit.
- Set Identifier (Entity ID) to the Databricks SAML URL you copied earlier.
For Reply URLs, enter both:
- The same Databricks SAML URL, and
- The
Grafana redirect URLs.
![Basic SAML Configuration]()
- Under SAML Signing Certificate, click Edit. Set Sign-in option to Sign SAML response and assertion, then click Save.
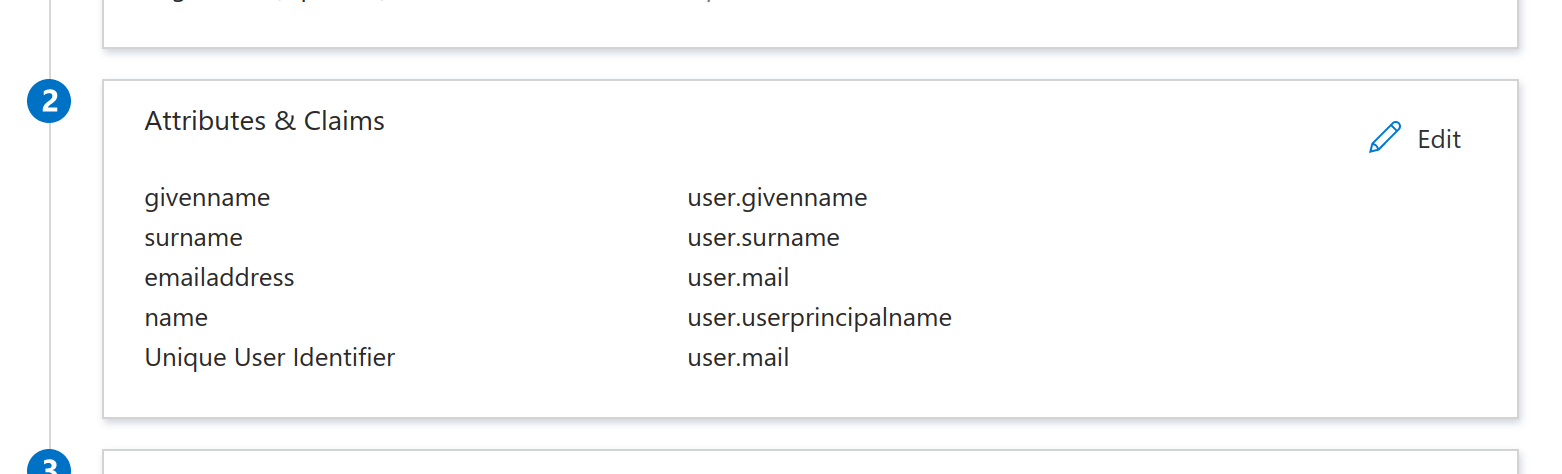
- Under Attributes & Claims, click Edit.
Set the Unique User Identifier (Name ID) field to
user.mail.![Basic SAML Configuration]()
- Under SAML Certificates, next to Certificate (Base64), click Download.
This downloads a
.cerfile. Copy its contents for later use in Databricks. - Also save the Login URL and Microsoft Entra ID Identifier for your Databricks configuration.
- Return to your Databricks SSO Settings tab and update the following fields:
- Single Sign-On URL - enter the Login URL from the previous step.
- Identity Provider Entity ID - enter the Microsoft Entra ID Identifier from the previous step.
- X.509 Certificate - paste the contents of the downloaded certificate.
Complete Grafana OAuth setup
To complete the Grafana OAuth setup, follow these steps:
In the Azure Portal, go to App registrations > All applications, and select your application.
On the Overview page, note the following values:
- Application (client) ID - Used as the OAuth client ID in your
grafana.inifile. - Directory (tenant) ID - Also required in your Grafana configuration.
- Application (client) ID - Used as the OAuth client ID in your
Click Endpoints, and note the following URLs:
- OAuth 2.0 authorization endpoint (v2) - This is your Authorization URL.
- OAuth 2.0 token endpoint (v2) - This is your Token URL.
Navigate to Certificates & secrets. Under Client secrets, click New client secret.
Create a new client secret with the following configuration:
- Description:
Grafana OAuth - Expires:
Never
- Description:
Click Add, then copy the Value of the newly created secret. This value is your OAuth client secret.
Define required roles
To enable secure access control and manage which users can query Databricks data through Grafana, you must define the appropriate roles in Microsoft Entra ID. This ensures that Grafana can properly authenticate and authorize users based on their assigned roles.
- In the Microsoft Entra ID portal, navigate to Enterprise applications.
- Search for your application and select it.
- Go to Users and groups.
- Click Add user/group to assign users or groups to the Grafana roles.
- Return to Microsoft Entra ID, then navigate to App registrations. Search for your application and select it.
- Go to App roles and configure the roles as described in Configure application roles for Grafana in the Azure portal.
- Configure Azure AD OAuth in the Grafana configuration file as described in Configure Azure AD authentication using the Grafana configuration file.
Forward token to users
To ensure user authentication tokens are securely forwarded to the Databricks data source, update your Grafana configuration file.
In your grafana.ini file, add or update the following setting:
[azure]
forward_settings_to_plugins = grafana-azure-monitor-datasource, prometheus, grafana-azure-data-explorer-datasource, mssql, grafana-databricks-datasource
This setting allows Grafana to forward Azure authentication tokens to supported data sources, including Databricks.
After saving your configuration, return to the Grafana data source settings page and set Authentication type to OAuth Passthrough.
Azure (On-Behalf-Of) authentication
Azure On-Behalf-Of (OBO) authentication allows Grafana to act on behalf of individual users using their own Azure Active Directory (Microsoft Entra ID) credentials. It applies only to Azure Databricks clusters and requires a user context, so it can’t run alert rules.
On-behalf-of authentication isn’t currently supported for private clouds (Azure China Cloud, Azure Government Cloud).
Warning
Avoid configuring alerts if your data source uses on-behalf-of authentication. Alert rules can’t run because there is no user context available to provide credentials for the query.
To configure on-behalf-of authentication, complete the following steps:
Configure Grafana to use OAuth2 with Microsoft Entra ID as documented. Ensure that the
[auth.azuread]scopes(or$GF_AUTH_AZUREAD_SCOPES) includes.default openid email profile offline_access.In the Azure Portal, go to App registrations > your application > Manage > Authentication. Enable ID tokens by selecting the corresponding checkbox.
In the Azure Portal, navigate to App registrations > your application > Manage > API permissions. Add the following permissions:
- Microsoft Graph:
User.Read - Azure Databricks:
user_impersonation
- Microsoft Graph:
In the Azure Portal, navigate to App registrations > your application > Security > Permissions. Enable Admin consent to grant consent on behalf of all users in the tenant. This prevents individual users from being prompted for consent when using the application.
When configuring the data source for an Azure Databricks cluster, navigate to your Databricks workspace: SQL Warehouses > Connection details > Server hostname and HTTP path. Use these values when setting up the data source in Grafana.
Use the Tenant ID, Client ID, and Client Secret from the application registration you created in step 1.
Azure Entra ID M2M authentication
Azure Entra ID M2M authentication authenticates Grafana directly as a service principal using the Azure Entra ID client credentials flow. Unlike On-Behalf-Of (OBO), this method doesn’t require a user context. Grafana authenticates as the application identity itself, which makes it suitable for automated or background workloads such as alerts and scheduled reports. This method applies only to Azure Databricks workspaces.
To use Azure Entra ID M2M authentication, complete the following steps:
In the Azure Portal, go to Microsoft Entra ID > App registrations > New registration. Create a new application and note its Application (client) ID and Directory (tenant) ID.
Under Certificates & secrets, create a new Client secret. Copy the Value. This is your Client Secret.
In your Databricks workspace, add the service principal and configure its permissions:
- Navigate to Settings > Identity and access > Service principals, then click Add service principal. Select Microsoft Entra ID managed and enter the Application (client) ID from step 1.
- Open the service principal and go to the Configuration tab. Under Entitlements, enable Databricks SQL access.
- Go to the Permissions tab and grant access to any users, service principals, or groups that should be able to manage or use this service principal. For more information, refer to Who can manage and use service principals? in the Azure Databricks documentation.
- Grant the service principal access to the SQL warehouse it queries. Navigate to SQL Warehouses, select your warehouse, open the Permissions tab, and add the service principal with at least Can use permission.
In Grafana, set Authentication type to Azure Entra ID M2M and enter the Directory (tenant) ID, Application (client) ID, and Client Secret from the steps above.
Additional configuration options
These options are optional and appear after the authentication fields in the data source settings. Use them to tune query behavior, enable Unity Catalog, and control connection routing.
Provision the data source
You can define and configure the data source in YAML files as part of the Grafana provisioning system. For general information about provisioning in Grafana, refer to Provision data sources.
Following is a provisioning example for the Databricks data source using Personal Access Token authentication:
apiVersion: 1
datasources:
  - name: Databricks
    type: grafana-databricks-datasource
    jsonData:
      host: community.cloud.databricks.com
      httpPath: path-from-databricks-odbc-settings
      authType: Pat
    secureJsonData:
      token: personal-access-token
Use Terraform to configure the Databricks data source
You can automate the configuration of the Databricks data source in Grafana using Terraform.
terraform {
  required_providers {
    grafana = {
      source  = "grafana/grafana"
      version = "~> 2.0"
    }
  }
}

provider "grafana" {
  url  = var.grafana_url
  auth = var.grafana_auth
}

variable "grafana_url" {
  description = "Grafana instance URL"
  type        = string
  default     = "http://localhost:3000"
}

variable "grafana_auth" {
  description = "Grafana API key or service account token"
  type        = string
  sensitive   = true
}

variable "databricks_host" {
  description = "Databricks workspace URL"
  type        = string
}

variable "databricks_token" {
  description = "Databricks personal access token"
  type        = string
  sensitive   = true
}

variable "databricks_http_path" {
  description = "HTTP path for Databricks SQL warehouse or cluster"
  type        = string
}

resource "grafana_data_source" "databricks" {
  name = "Databricks"
  type = "grafana-databricks-datasource"

  json_data_encoded = jsonencode({
    host     = var.databricks_host
    httpPath = var.databricks_http_path
    authType = "Pat"
  })

  secure_json_data_encoded = jsonencode({
    token = var.databricks_token
  })

  # Optional: Set as default data source
  is_default = false
}

output "datasource_id" {
  description = "The ID of the created Databricks data source"
  value       = grafana_data_source.databricks.id
}

output "datasource_uid" {
  description = "The UID of the created Databricks data source"
  value       = grafana_data_source.databricks.uid
}
To deploy this configuration, create a terraform.tfvars file with your specific values:
grafana_url          = "https://your-grafana.com"
grafana_auth         = "your-api-key"
databricks_host      = "https://your-workspace.cloud.databricks.com"
databricks_token     = "your-databricks-token"
databricks_http_path = "/sql/1.0/warehouses/your-warehouse-id"
Initialize and apply the configuration:
terraform init
terraform plan
terraform apply
The configuration uses the Grafana Terraform provider to create the data source with secure storage of credentials. You can set is_default to true if you want this to be your default data source in Grafana.
Was this page helpful?
Related resources from Grafana Labs


