

ClickHouse OpenTelemetry dashboards
The plugin ships four pre-built dashboards for OpenTelemetry data stored in ClickHouse. Three cover top-down log exploration, service topology and trace search, and a single-service deep dive that ties RED metrics, errors, logs, and trace detail into one view; a fourth is a variant of the logs explorer for tables that store OTel attributes as the native JSON type.
The core three dashboards link to each other via dashboard data links: clicking a service or operation in one dashboard preserves the time range, datasource and selected database, and lands you on the matching view in another.
Required schema
The dashboards expect the standard table layout produced by the ClickHouse exporter for the OpenTelemetry Collector:
- A logs table named
otel_logs. - A traces table named
otel_traces.
All four dashboards expose a Database template variable and qualify every table reference as ${database}.otel_logs / ${database}.otel_traces, so you pick the database that holds the OTel tables from the dashboard itself instead of relying on the data source’s Default database setting.
The three Map-schema dashboards (Logs Explorer, Traces Explorer, and the single-service deep dive) link to each other and forward the selected database between them, so their Database variable lists only databases that hold both otel_logs and otel_traces. Splitting logs and traces across separate databases is not supported by these three: the selector would list nothing rather than offer a database whose panels cannot all resolve.
The JSON-schema Logs Explorer lists databases whose otel_logs.ResourceAttributes column uses the native JSON type. Its panels only need otel_logs; the otel_traces table is required solely by the optional deployment annotation, which is disabled by default, so a logs-only database works there.
Both selectors read system.tables / system.columns, so the data source user needs read access to them. If you renamed the OTel exporter tables, the dashboards do not pick the new names up automatically; either restore the standard names or duplicate the dashboards and edit the SQL.
The dashboards rely on the columns the exporter ships with: Timestamp, Body, SeverityText, ServiceName, TraceId, SpanId, ResourceAttributes for logs; TraceId, ServiceName, SpanName, Timestamp, Duration, StatusCode, SpanKind, ParentSpanId, SpanAttributes, ResourceAttributes for traces.
StatusCode is matched against both 'Error' and 'STATUS_CODE_ERROR', the error values the current ClickHouse exporter writes.
OpenTelemetry Logs Explorer
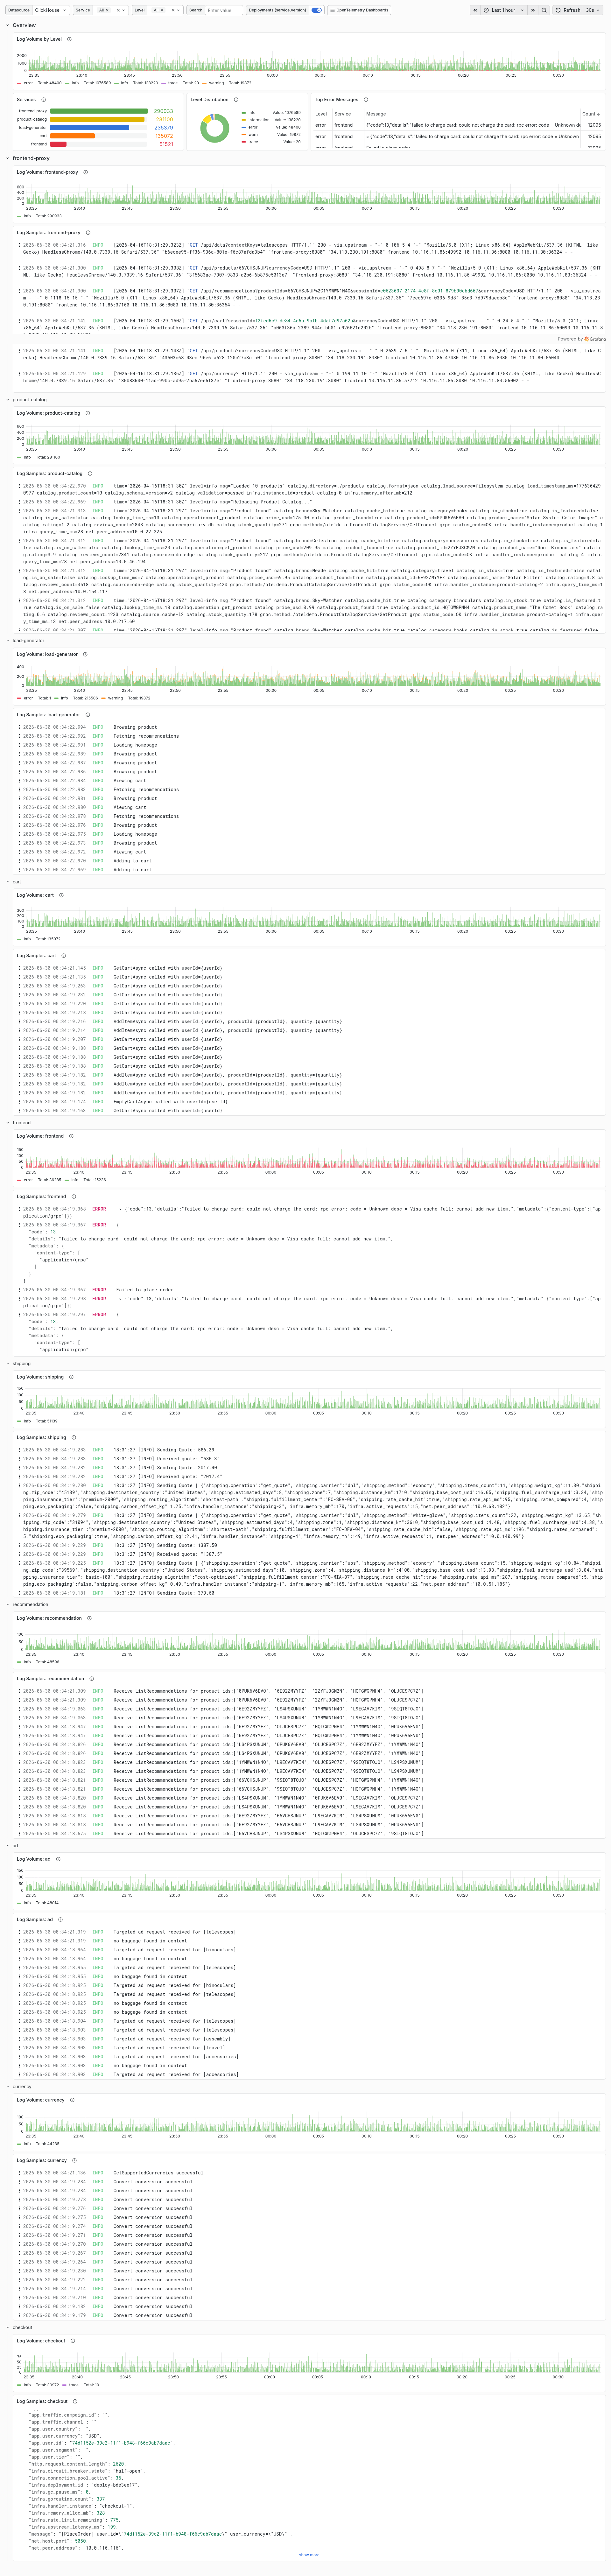
A multi-service log overview. Top row: stacked log volume by SeverityText, top services bar gauge with click-to-filter (click a bar to scope the dashboard to that service), severity donut, and a Top Error Messages table that strips common id-style tokens (userId, traceId, etc.) before grouping so similar messages cluster.
Below the overview, a per-service row repeats once per service in the Service variable. Each repeat stacks a full-width Log Volume timeseries above a full-width Log Samples panel so log messages wrap less and the expand-row attribute view has room to breathe. JSON-shaped log bodies are pretty-printed.
Both per-service panels have an Open in Explore link in the panel header that pre-fills a matching query for that row’s service in Explore. The Log Volume link drops you into a time-series query; the Log Samples link drops you into the logs visualization with the same column projection as the dashboard panel. Because the per-service row repeats once per selected service, each panel-header link is scoped to its row’s $service value.
Filter variables: Database (selects the database that holds the OTel tables; needs read access to system.tables), Service (multi, defaults to top 10 by volume), Level (multi), Search (textbox; passes through to positionCaseInsensitive(Body, ...), a case-insensitive substring match).
Annotations: deployment markers derived from service.version changes in otel_traces over 30-second buckets.
OpenTelemetry Logs Explorer (JSON schema)
A variant of the OpenTelemetry Logs Explorer for deployments where the otel_logs attribute columns (ResourceAttributes, LogAttributes, ScopeAttributes) use ClickHouse’s native JSON type instead of Map(String, String) — the ClickStack schema. The panels are identical except that the Log Samples panel reads attributes with JSON path access (for example ResourceAttributes.service.namespace::String) instead of Map key access. Because the two access styles are not interchangeable within a single query, this ships as a separate dashboard rather than a mode of the Map dashboard. The deployment annotation reads otel_traces, which is left as Map.
OpenTelemetry Traces Explorer
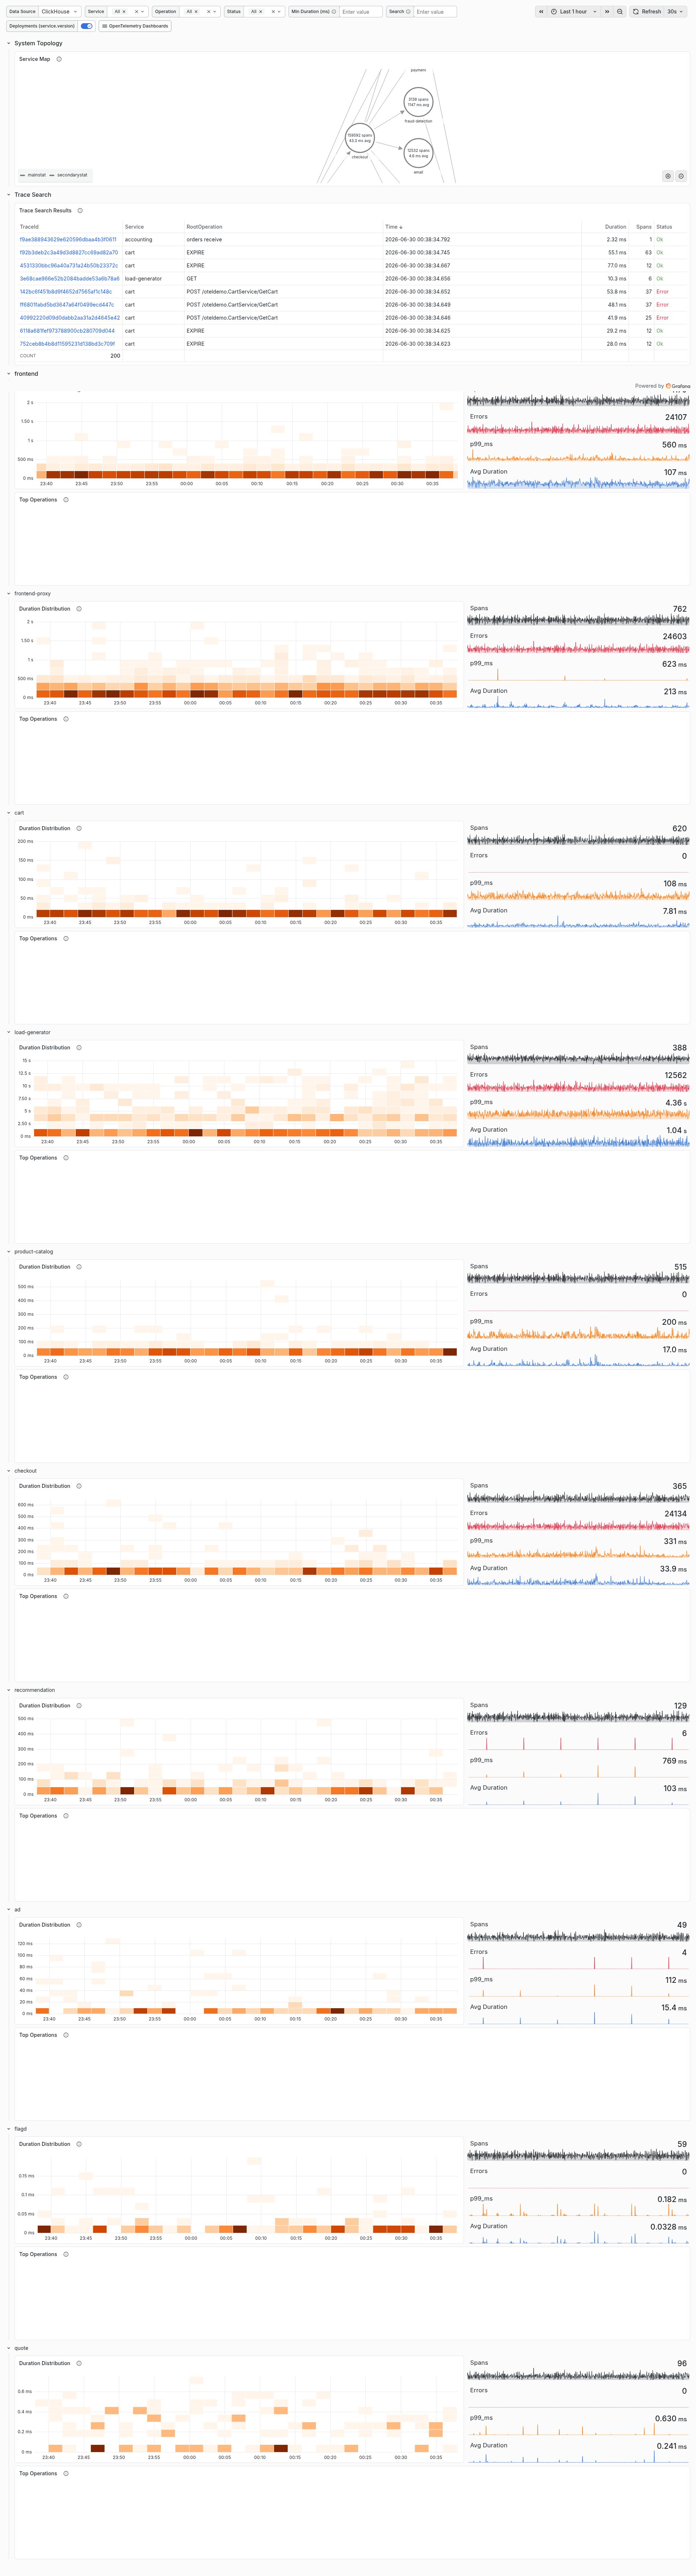
System topology + trace search. Top row: service map node graph computed from parent.SpanId = child.ParentSpanId joins on otel_traces, limited to the top 30 services and top 50 inter-service edges. Node arcs show success/error fractions; edge labels show call counts.
Trace Search Results lists recent traces matching the variable filters (Service, Operation, Status, Min Duration). Click a TraceId to open Grafana’s trace view for that trace; click a Service to open the OpenTelemetry Service Dashboard for that service; click an Operation to filter this view.
Below trace search, a per-service row repeats once per service: a 1-in-500 sampled duration heatmap, four sparkline stats (Spans, Errors, P99, Avg Duration), and a Top Operations table with error counts color-coded by error percent.
Each per-service panel has an Open in Explore link in its panel header that pre-fills a matching query in Explore.
Filter variables: Database (selects the database that holds the OTel tables), Service (multi), Operation (multi), Status (multi), Min Duration (ms) (textbox; leave blank for no minimum, passes through $__conditionalAll), Search (textbox; free-text match on SpanName applied to every trace panel).
OpenTelemetry Service Dashboard
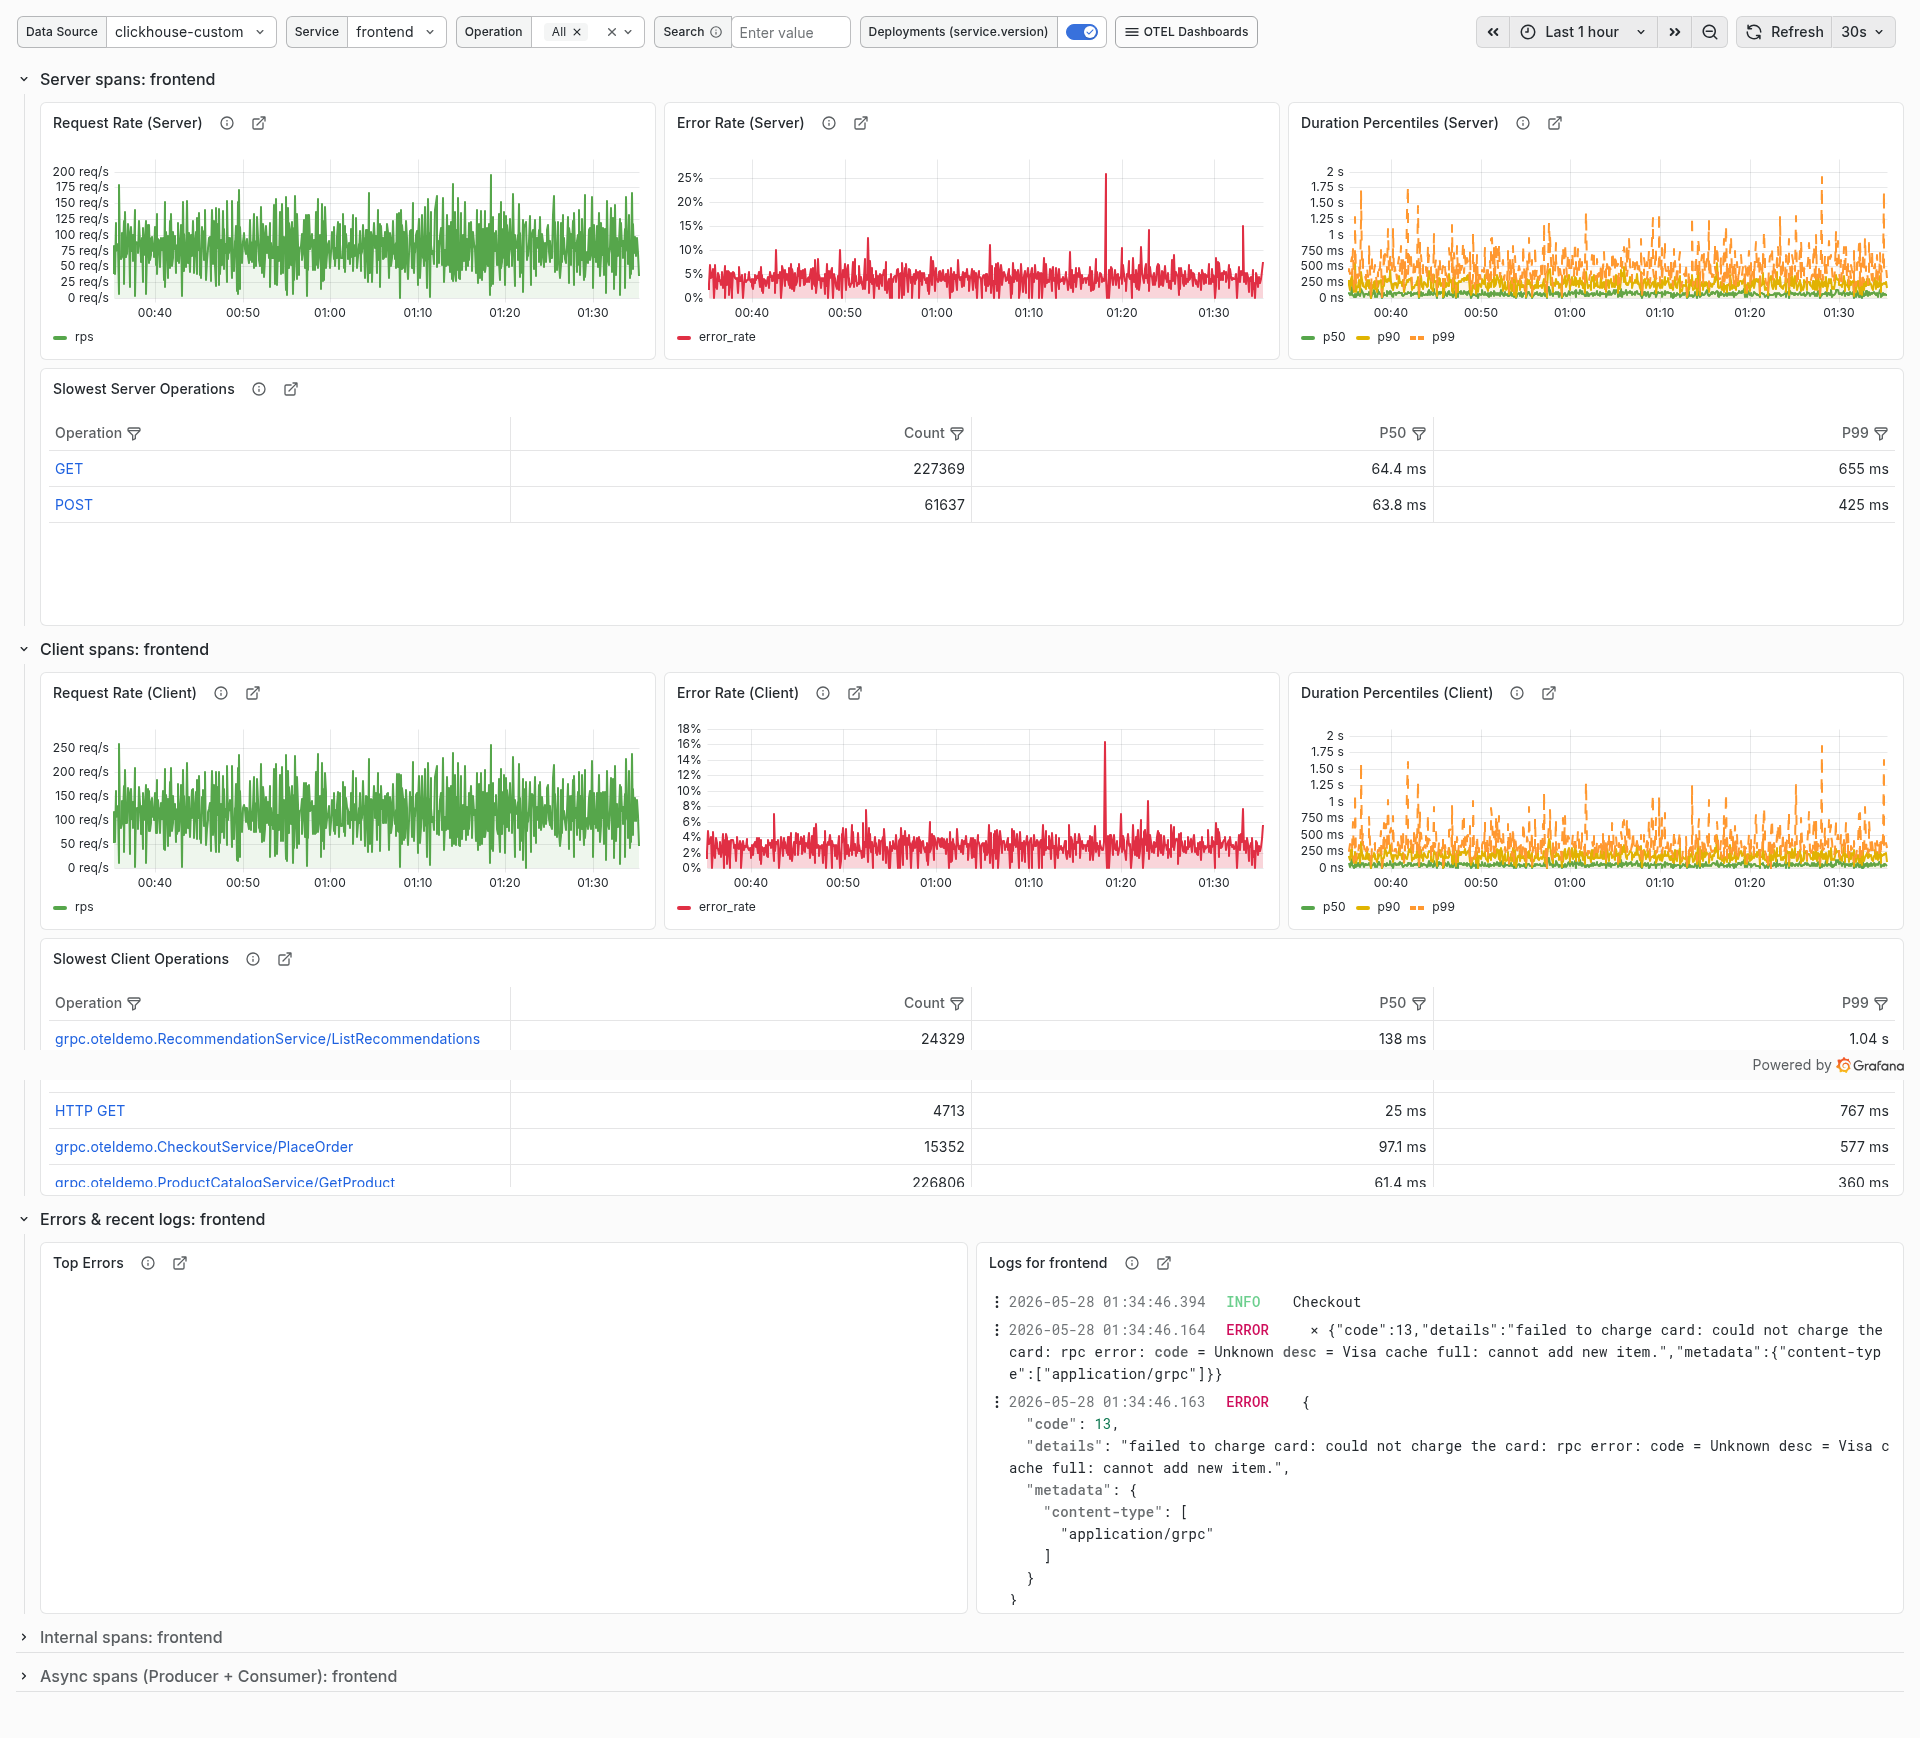
Single-service deep dive, broken out by SpanKind. Top to bottom:
- Server spans (expanded): RED metrics (Request Rate, Error Rate with green/yellow/red thresholds at 1% and 5%, Duration Percentiles with P50 and P90 solid and P99 dashed orange) and Slowest Server Operations table. Server spans are incoming requests this service handles.
- Client spans (expanded): same RED layout filtered to outgoing requests, plus Slowest Client Operations. Use these to spot slow dependencies.
- Errors & recent logs (expanded): Top Errors table (with a SpanKind column so you can tell which side produced each error) and recent logs for the service, side by side.
- Internal spans (collapsed by default): RED metrics and Slowest Internal Operations for in-process work (function-level instrumentation). Click the row header to expand.
- Async spans (Producer + Consumer) (collapsed by default): RED metrics and Slowest Async Operations for message production and consumption against queues or event buses. The Slowest Async Operations table includes a SpanKind column so you can tell Producer from Consumer at a glance.
Click any operation in any Slowest Operations or Top Errors table to open the matching trace search in OpenTelemetry Traces Explorer.
Filter variables: Database (selects the database that holds the OTel tables), Service (single-select), Operation (multi), Search (textbox; free-text match on SpanName for trace panels and on Body for the Logs panel).
Each non-row panel has an Open in Explore link in its header that pre-fills the panel’s underlying query in Explore. Useful when you want to refine the SQL, change visualization, or read log details with more horizontal space.
To see a specific trace, open OpenTelemetry Traces Explorer and click a TraceId in Trace Search Results. That opens Grafana’s trace view in a side pane.
Cross-dashboard navigation
Each dashboard has an OpenTelemetry Dashboards link in the top-right that drops down to the other two, preserving variables and time range.
Data links between panels carry the same context:
- OpenTelemetry Traces Explorer → trace view: clicking a TraceId in Trace Search Results opens Grafana’s trace view for that trace.
- OpenTelemetry Traces Explorer → OpenTelemetry Service Dashboard: clicking a Service in Trace Search Results opens the Service Dashboard filtered to that service.
- OpenTelemetry Service Dashboard → OpenTelemetry Traces Explorer: clicking an operation in Top Errors or Slowest Operations opens trace search filtered to that service and operation.
- OpenTelemetry Logs Explorer: clicking a service in the bar gauge self-filters the dashboard to that service.
Performance considerations
- The service map in OpenTelemetry Traces Explorer self-joins
otel_tracesonParentSpanId. On large traces tables this can be slow. If you exceed the demo data scale, consider sampling on the join side or backing the dashboard with a materialized view that pre-computes parent-child edges. - The duration heatmap on OpenTelemetry Traces Explorer is sampled at 1-in-500 spans (
cityHash64(SpanId) % 500 = 0) to keep heatmap cardinality low. Adjust the sampling fraction in the panel SQL if you have lower trace volume and want denser heatmaps. - All dashboards default to a 30-second auto-refresh and a 1-hour time range. Widen the time range gradually; the trace queries scan
otel_tracesover the full range each refresh.
Customizing
The dashboards are JSON files in the plugin source under src/dashboards/. Import a copy via Dashboards > New > Import, edit it, and save under a new UID. The plugin-shipped versions get refreshed on every plugin update; your copy is stable.
Common customizations:
- Different table names: replace the literal
otel_logs/otel_tracesreferences in the panel SQL. - Per-environment defaults: add an environment variable and an extra
WHEREclause via$__conditionalAll. - Extra filters: the
$__conditionalAll(EXPR, $var)macro suppresses the clause when$varis empty, so you can add optional filters without breaking the empty-state.
Related resources
Was this page helpful?
Related resources from Grafana Labs


