
Set up production instrumentation for Java
Follow these steps set up production Application Observability with a telemetry collector:
- Install the instrumentation library
- Configure an application
- Set up a telemetry data collector
- Run the application
- Observe the service in Application Observability
Note
For a quick and easy local development setup, consult the quickstart documentation.
Install the instrumentation library
First, download the latest JAR release of the instrumentation agent from the release page of the Grafana OpenTelemetry auto-instrumentation Distribution for Java.
Configure an application
Next, customize the following shell script to configure an application:
export OTEL_SERVICE_NAME=<Service Name>
export OTEL_RESOURCE_ATTRIBUTES=deployment.environment=<Environment>,service.namespace=<Namespace>,service.version=<Version>

java -javaagent:path/to/grafana-opentelemetry-java.jar -jar myapp.jar
- Choose a Service Name to identify the service, for example
cart - Add attributes to filter data:
- deployment.environment: Name of the deployment environment (
stagingorproduction) - service.namespace: A namespace to group similar services
(e.g.
shopwould createshop/cartin Application Observability) - service.version: The application version, to see if a new version has introduced a bug
- deployment.environment: Name of the deployment environment (
- Replace
myapp.jarwith the path to the application to instrument
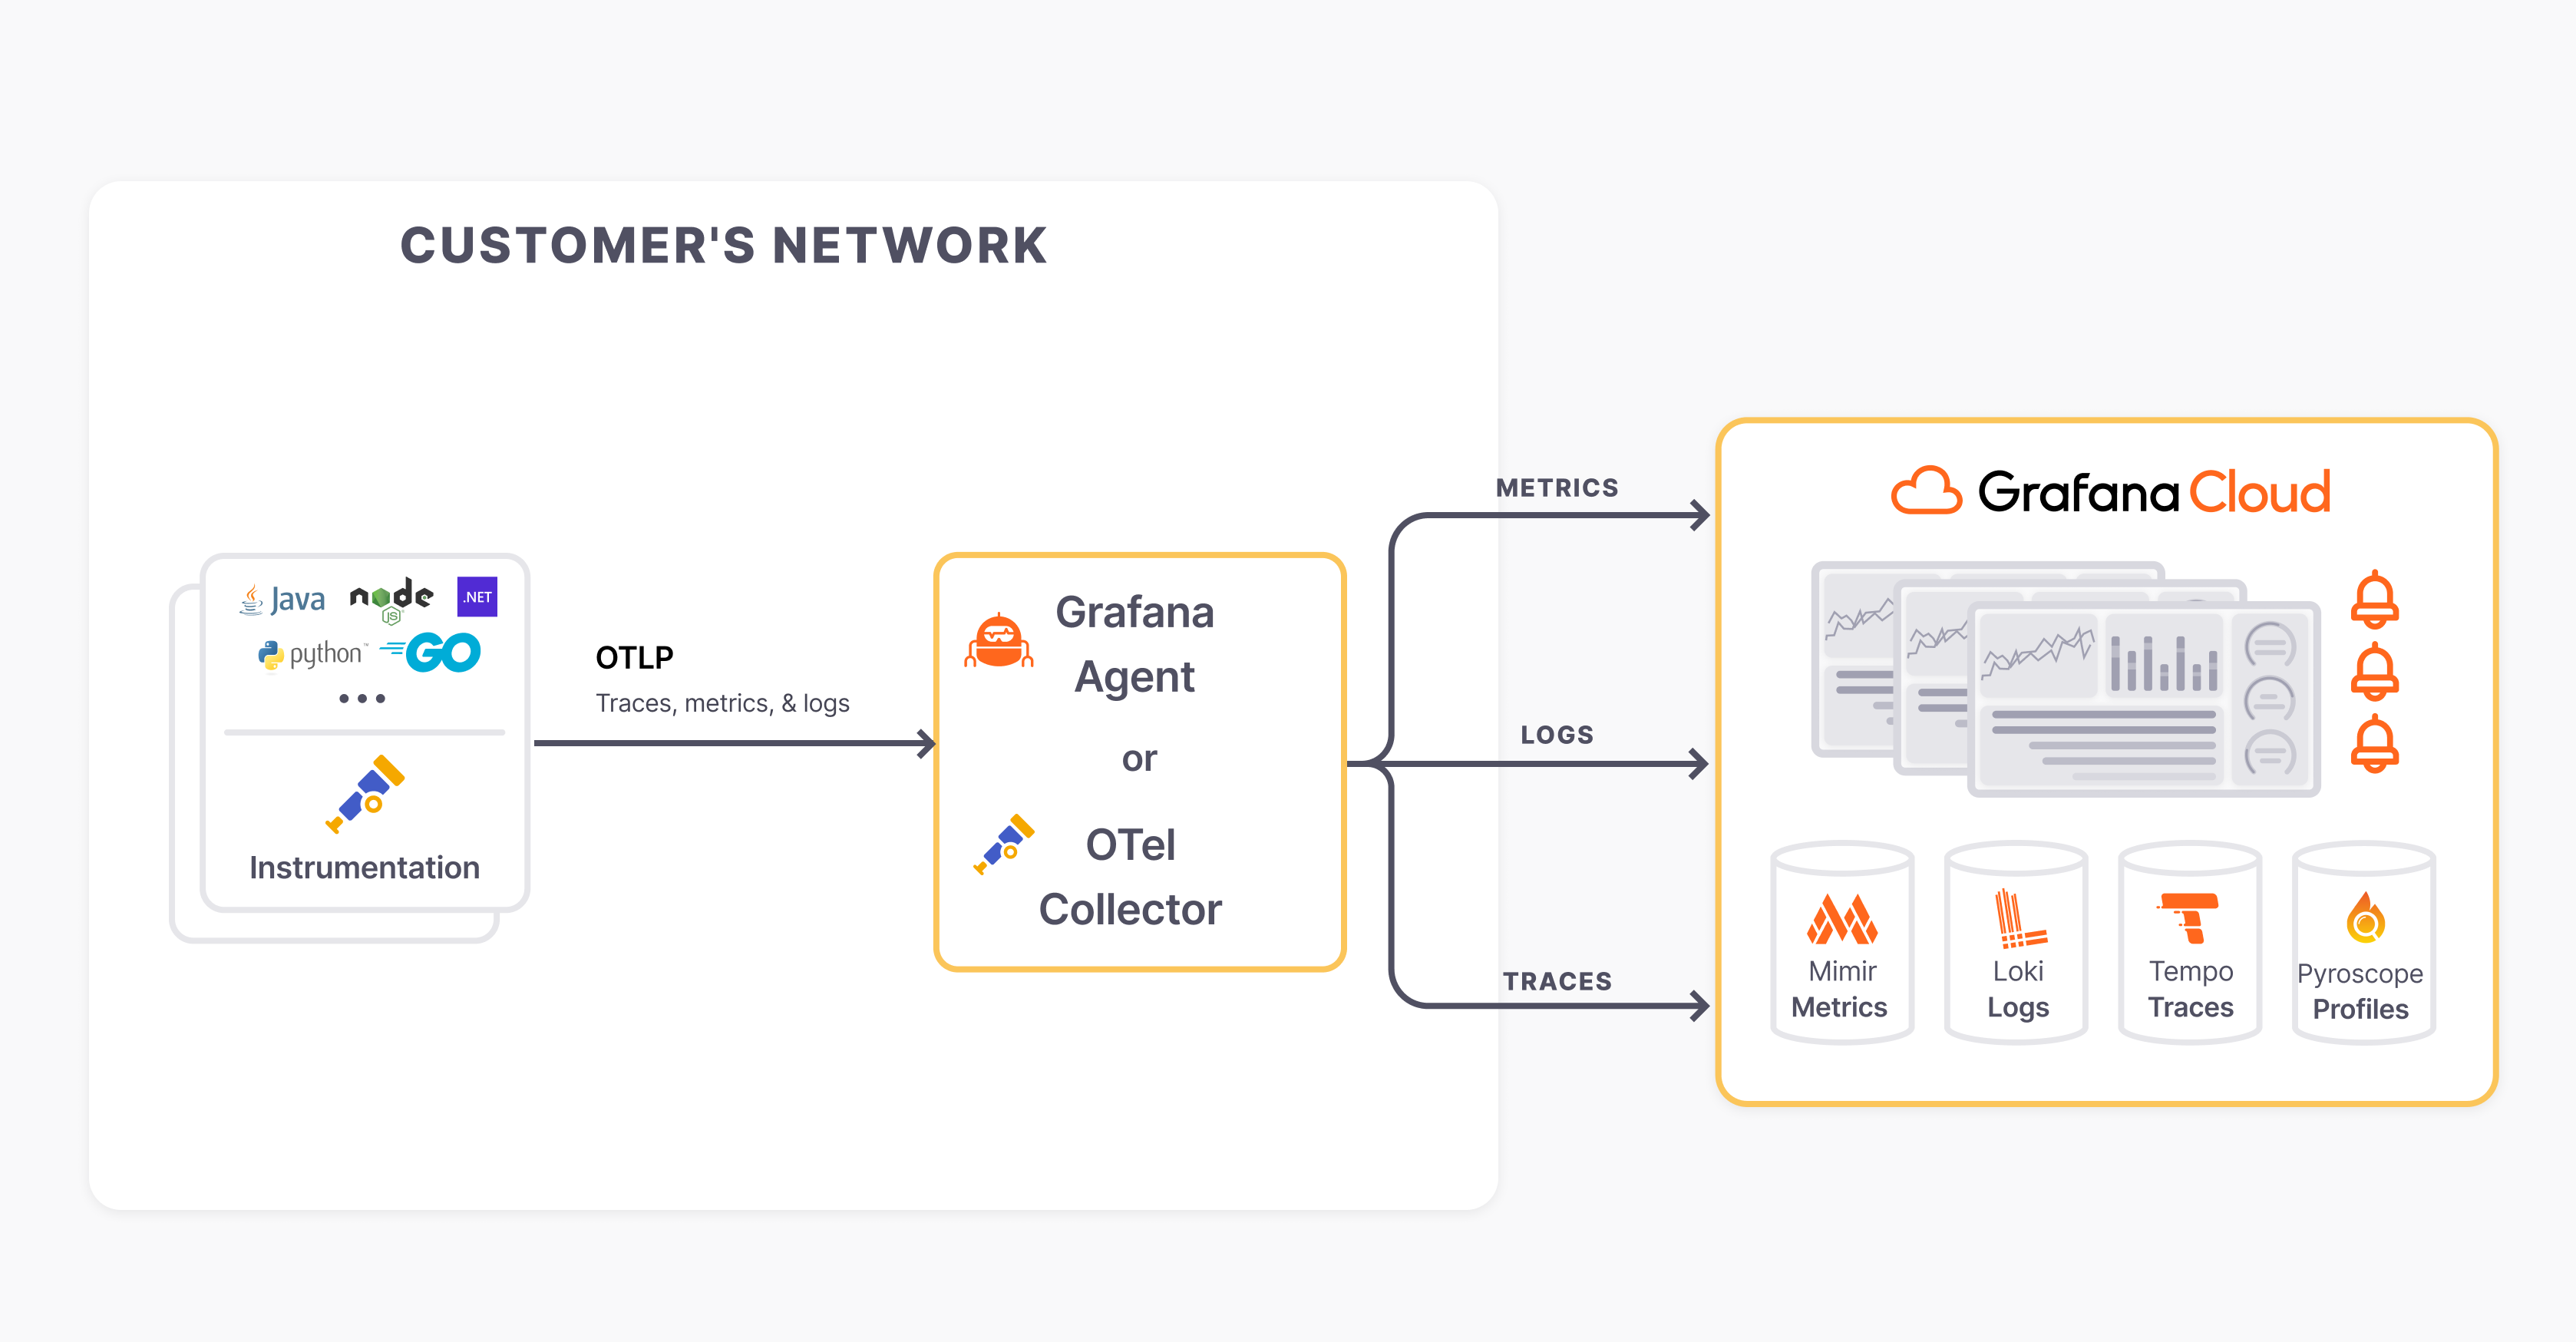
Set up a telemetry data collector
In production environments, a robust and flexible observability setup needs to process telemetry data before ingestion into databases. Follow the collector setup documentation to set up a collector to process and send telemetry data to Application Observability.
Finally, set the following environment variables from the exporter configuration:
| Configuration | Options | Result |
|---|---|---|
export OTEL_EXPORTER_OTLP_ENDPOINT=<host> | http://localhost:4317, remote host address | The default local host address, or a remote host address. |
export OTEL_EXPORTER_OTLP_PROTOCOL=<protocol> | grpc, http/protobuf | The default grpc protocol or http/protobuf |
For example, for a local Grafana Alloy:
export OTEL_EXPORTER_OTLP_ENDPOINT=http://localhost:4317
export OTEL_EXPORTER_OTLP_PROTOCOL=grpc
Set the OpenTelemetry Service name and resource attributes and run the application with the Grafana OpenTelemetry Java agent:
System properties can be used instead of environment variables, for example -Dotel.service.name=<OTEL_SERVICE_NAME> instead of export OTEL_SERVICE_NAME=<OTEL_SERVICE_NAME>
Run the application
Finally, run the application with the shell script and make some requests to the service to send data to Grafana Cloud.
Observe the service in Application Observability
Open Application observability:
- Navigate to a stack
https://<your-stack-name.>grafana.net - Expand the top left menu below the Grafana logo
- Click on Application
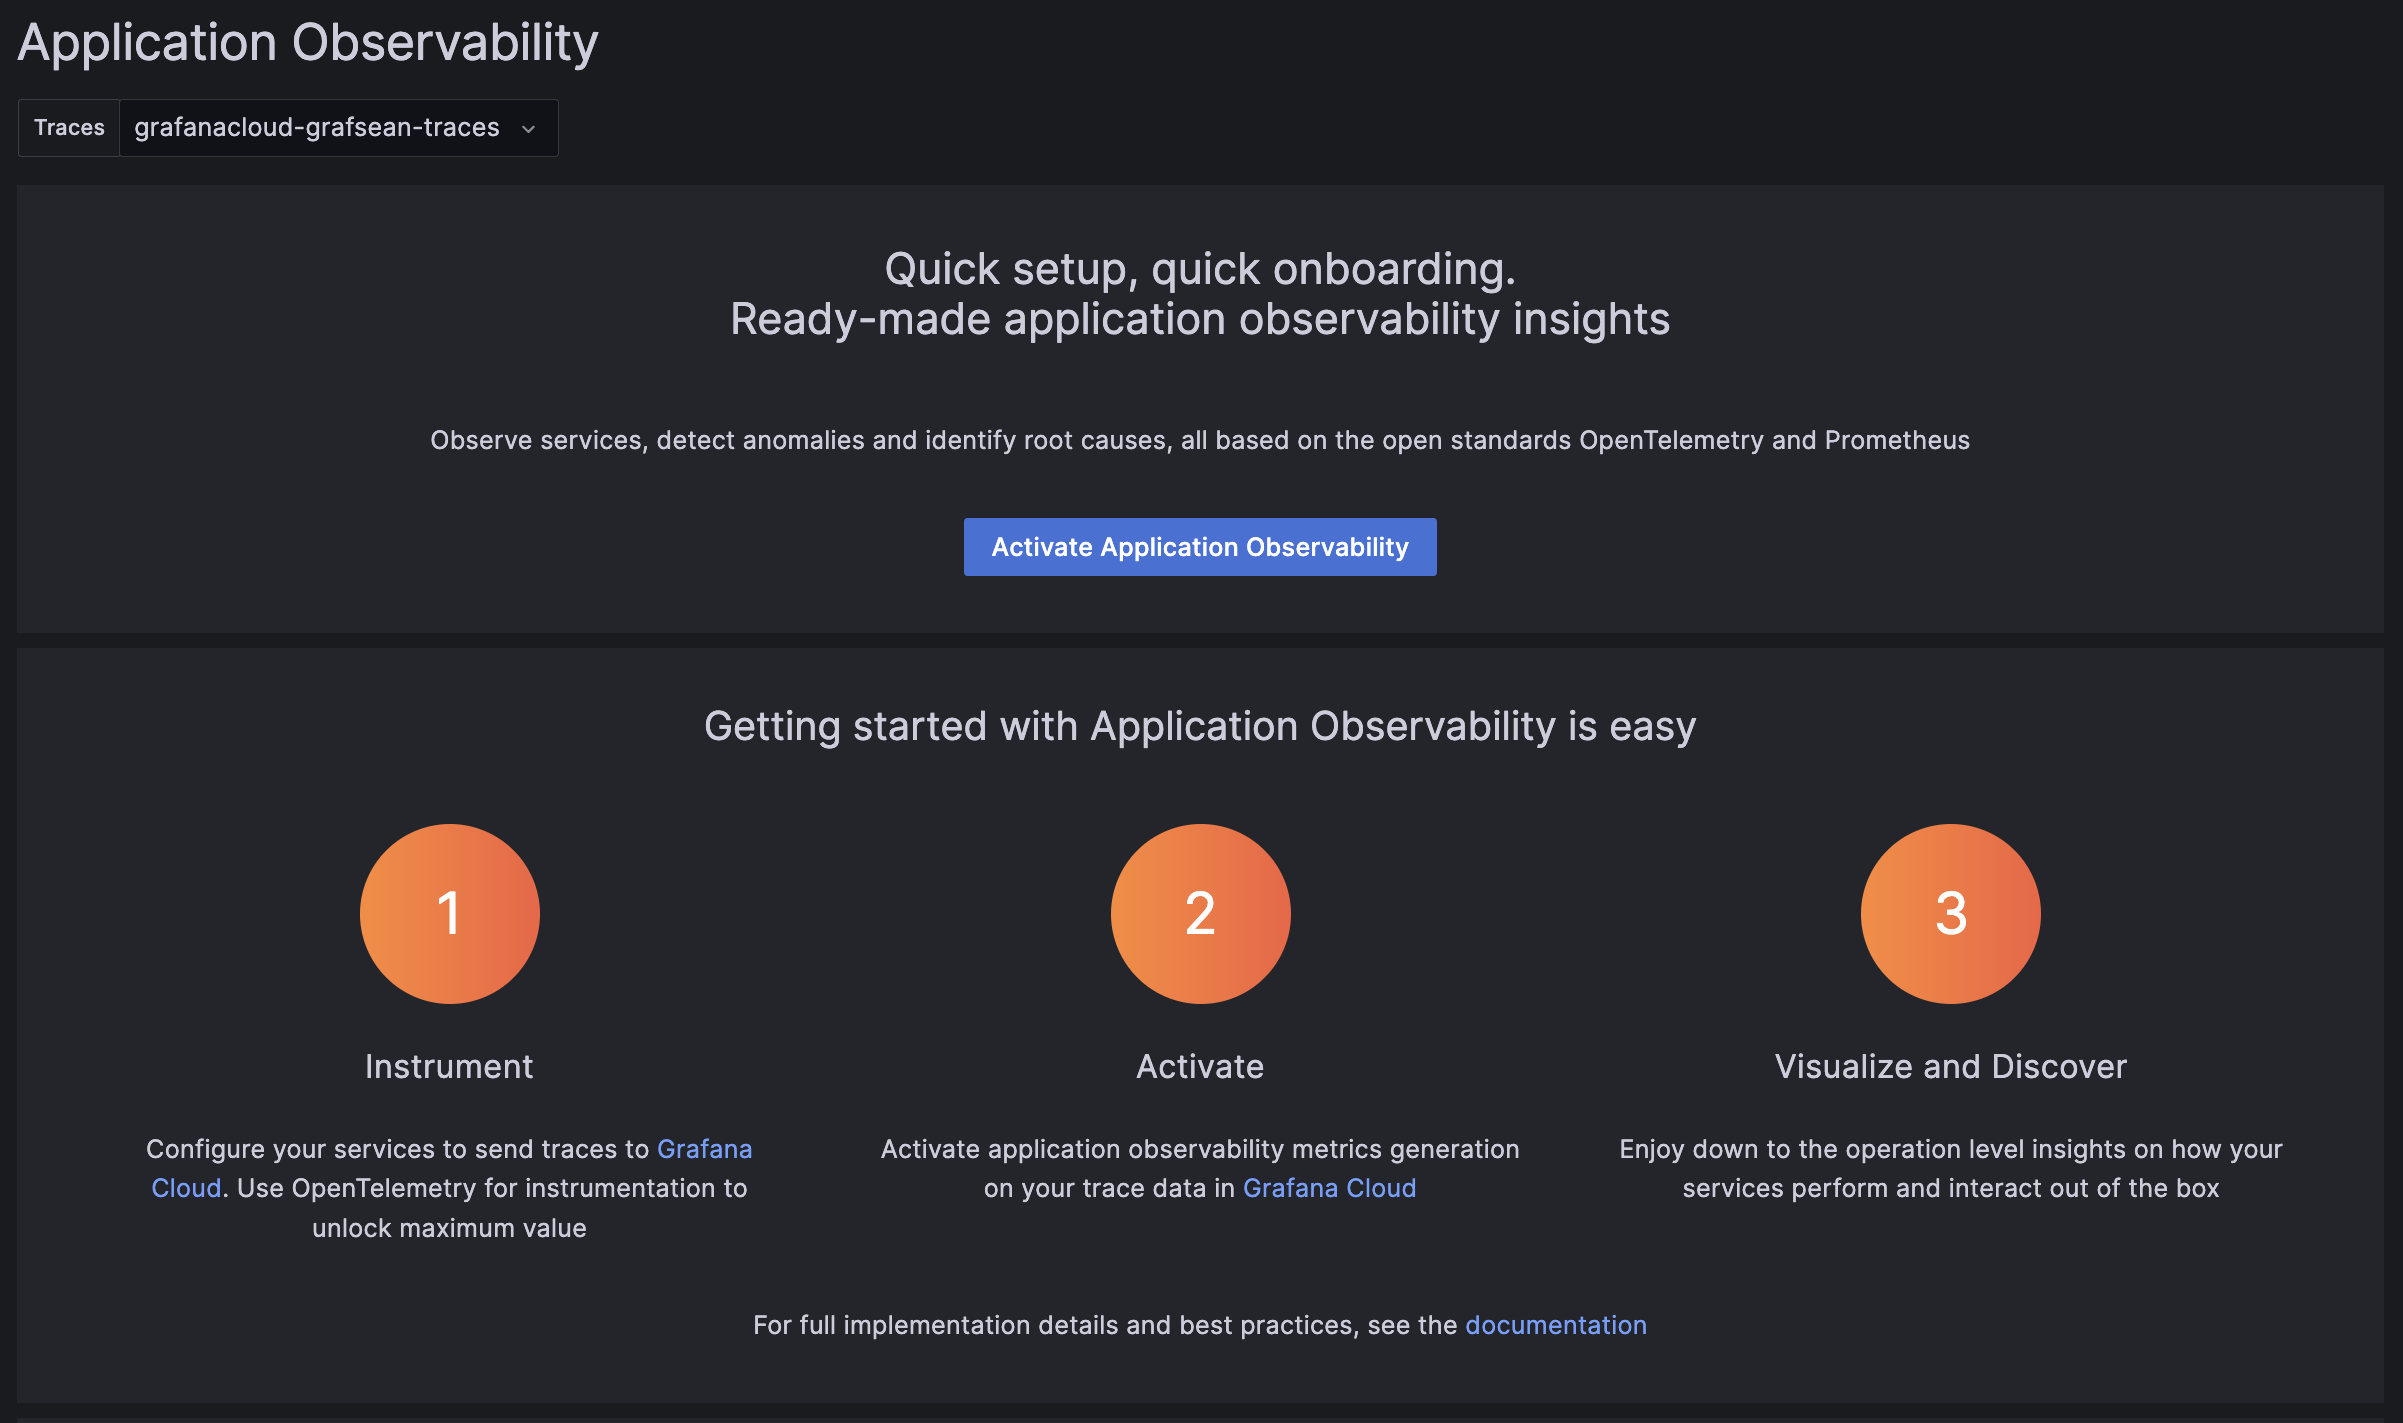
Activate metrics generation
Application Observability relies on metrics generated from traces already sent to Grafana Cloud Traces.
Metrics generation is self-serve, and can be enabled during onboarding and disabled from Application Observability configuration.
To complete the setup, click Activate Application Observability to enable metrics generation.
Note
After activating Application Observability and enabling metrics generation, it might take up to five minutes to generate metrics and show graphs.
Visualize and discover
Discover more about Application Observability in the documentation:
- Service Inventory: filter, and search services and view RED metrics.
- Service Overview: traces, logs, RED metrics, operations, and runtime information.
- Service Map: graph of connected services, service dependencies, and data flow.
If you run into any issue, please consult the troubleshooting guide.
Example application
See the Grafana OpenTelemetry Java Spring PetClinic configuration for a complete example production setup.
Was this page helpful?
Related resources from Grafana Labs


