
Menu
Grafana Cloud
Pingdom integration for Grafana OnCall
This integration is not available in OSS version
The Pingdom integration for Grafana OnCall handles ticket events sent from Pingdom webhooks. The integration provides grouping, auto-acknowledge and auto-resolve logic via customizable alert templates.
You must have the role of Admin to be able to create integrations in Grafana OnCall.
Configuring Grafana OnCall to Receive Alerts from Pingdom
- In the Integrations tab, click + New integration.
- Select Pingdom from the list of available integrations.
- Enter a name and description for the integration, click Create
- A new page will open with the integration details. Copy the OnCall Integration URL from HTTP Endpoint section.
Configuring Pingdom to Send Alerts to Grafana OnCall
- Go to https://my.pingdom.com/integrations/settings
- Click “Add Integration”.
- Type: Webhook. Name:
Grafana OnCall. URL: OnCall Integration URL - Go to “Reports” -> “Uptime” -> “Edit Check”.
- Select
Grafana OnCallintegration in the bottom. - Click “Modify Check” to save.
Was this page helpful?
Related resources from Grafana Labs
Getting started with Grafana OnCall for on-call management (APAC Timezone)
This webinar goes over initial Grafana OnCall configuration, setting up an on-call management process, grouping, alert rendering, and organizing runbooks.
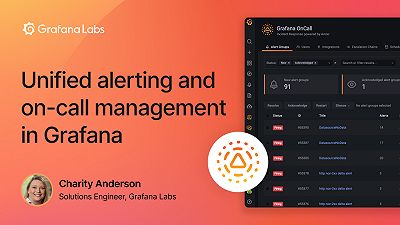
Unified alerting and on-call management in Grafana
In this webinar, we’ll demo the Grafana 8 unified alerting system, and introduce Grafana OnCall, our on-call management tool to resolve incidents faster.

Reducing resolution time (MTTR) with the Grafana LGTM Stack and on-call management
See a demo of Grafana OnCall, and how to correlate your metrics, logs, and traces to reduce your MTTR using Grafana’s “single pane of glass” approach.