Documentation for automated readers
A curated documentation index is available at: https://grafana.com/llms.txt
A complete documentation index is available at: https://grafana.com/llms-full.txt
These indexes can help with page discovery before fetching individual documents.
This page is also available in Markdown, which may be easier for automated readers and AI tools to parse than HTML. The Markdown version is available at https://grafana.com/docs/mimir/v3.1.x/manage/monitor-grafana-mimir/dashboards/config.md, or by sending Accept: text/markdown to https://grafana.com/docs/mimir/v3.1.x/manage/monitor-grafana-mimir/dashboards/config/. For broader documentation discovery, the curated index is available at https://grafana.com/llms.txt and the complete index is available at https://grafana.com/llms-full.txt.
Grafana Mimir Config dashboard
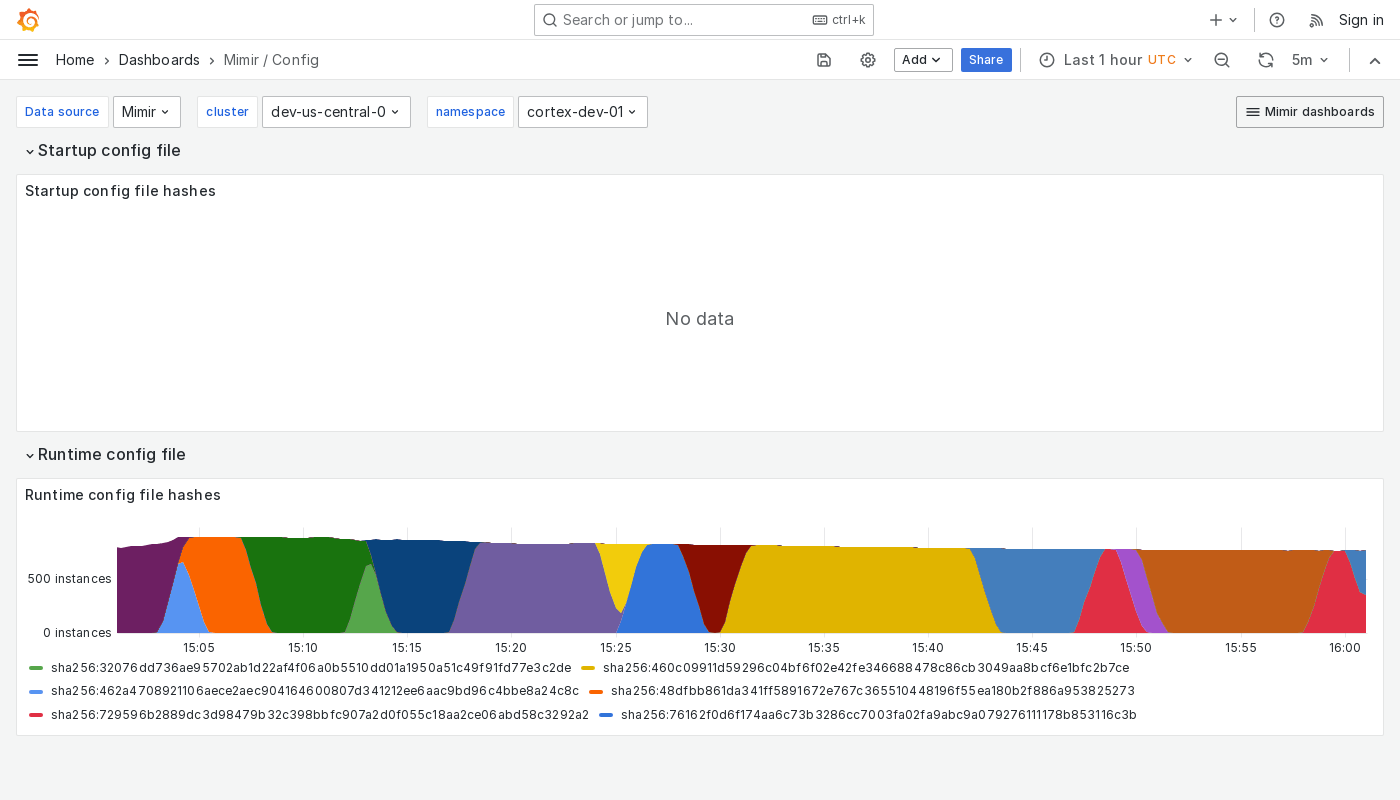
The Config dashboard shows details about the runtime configuration currently loaded by each Grafana Mimir instance.
Use this dashboard for the following use cases:
- Ensure that all instances in a Mimir cluster are running with the correct configuration settings.
- Compare configurations across instances to identify discrepancies that might lead to unexpected behavior.
Example
The following example shows a Config dashboard from a demo cluster.

Was this page helpful?
Related resources from Grafana Labs

