Documentation for automated readers
A curated documentation index is available at: https://grafana.com/llms.txt
A complete documentation index is available at: https://grafana.com/llms-full.txt
These indexes can help with page discovery before fetching individual documents.
This page is also available in Markdown, which may be easier for automated readers and AI tools to parse than HTML. The Markdown version is available at https://grafana.com/docs/mimir/v3.1.x/manage/monitor-grafana-mimir/dashboards/alertmanager-resources.md, or by sending Accept: text/markdown to https://grafana.com/docs/mimir/v3.1.x/manage/monitor-grafana-mimir/dashboards/alertmanager-resources/. For broader documentation discovery, the curated index is available at https://grafana.com/llms.txt and the complete index is available at https://grafana.com/llms-full.txt.
Grafana Mimir Alertmanager resources dashboard
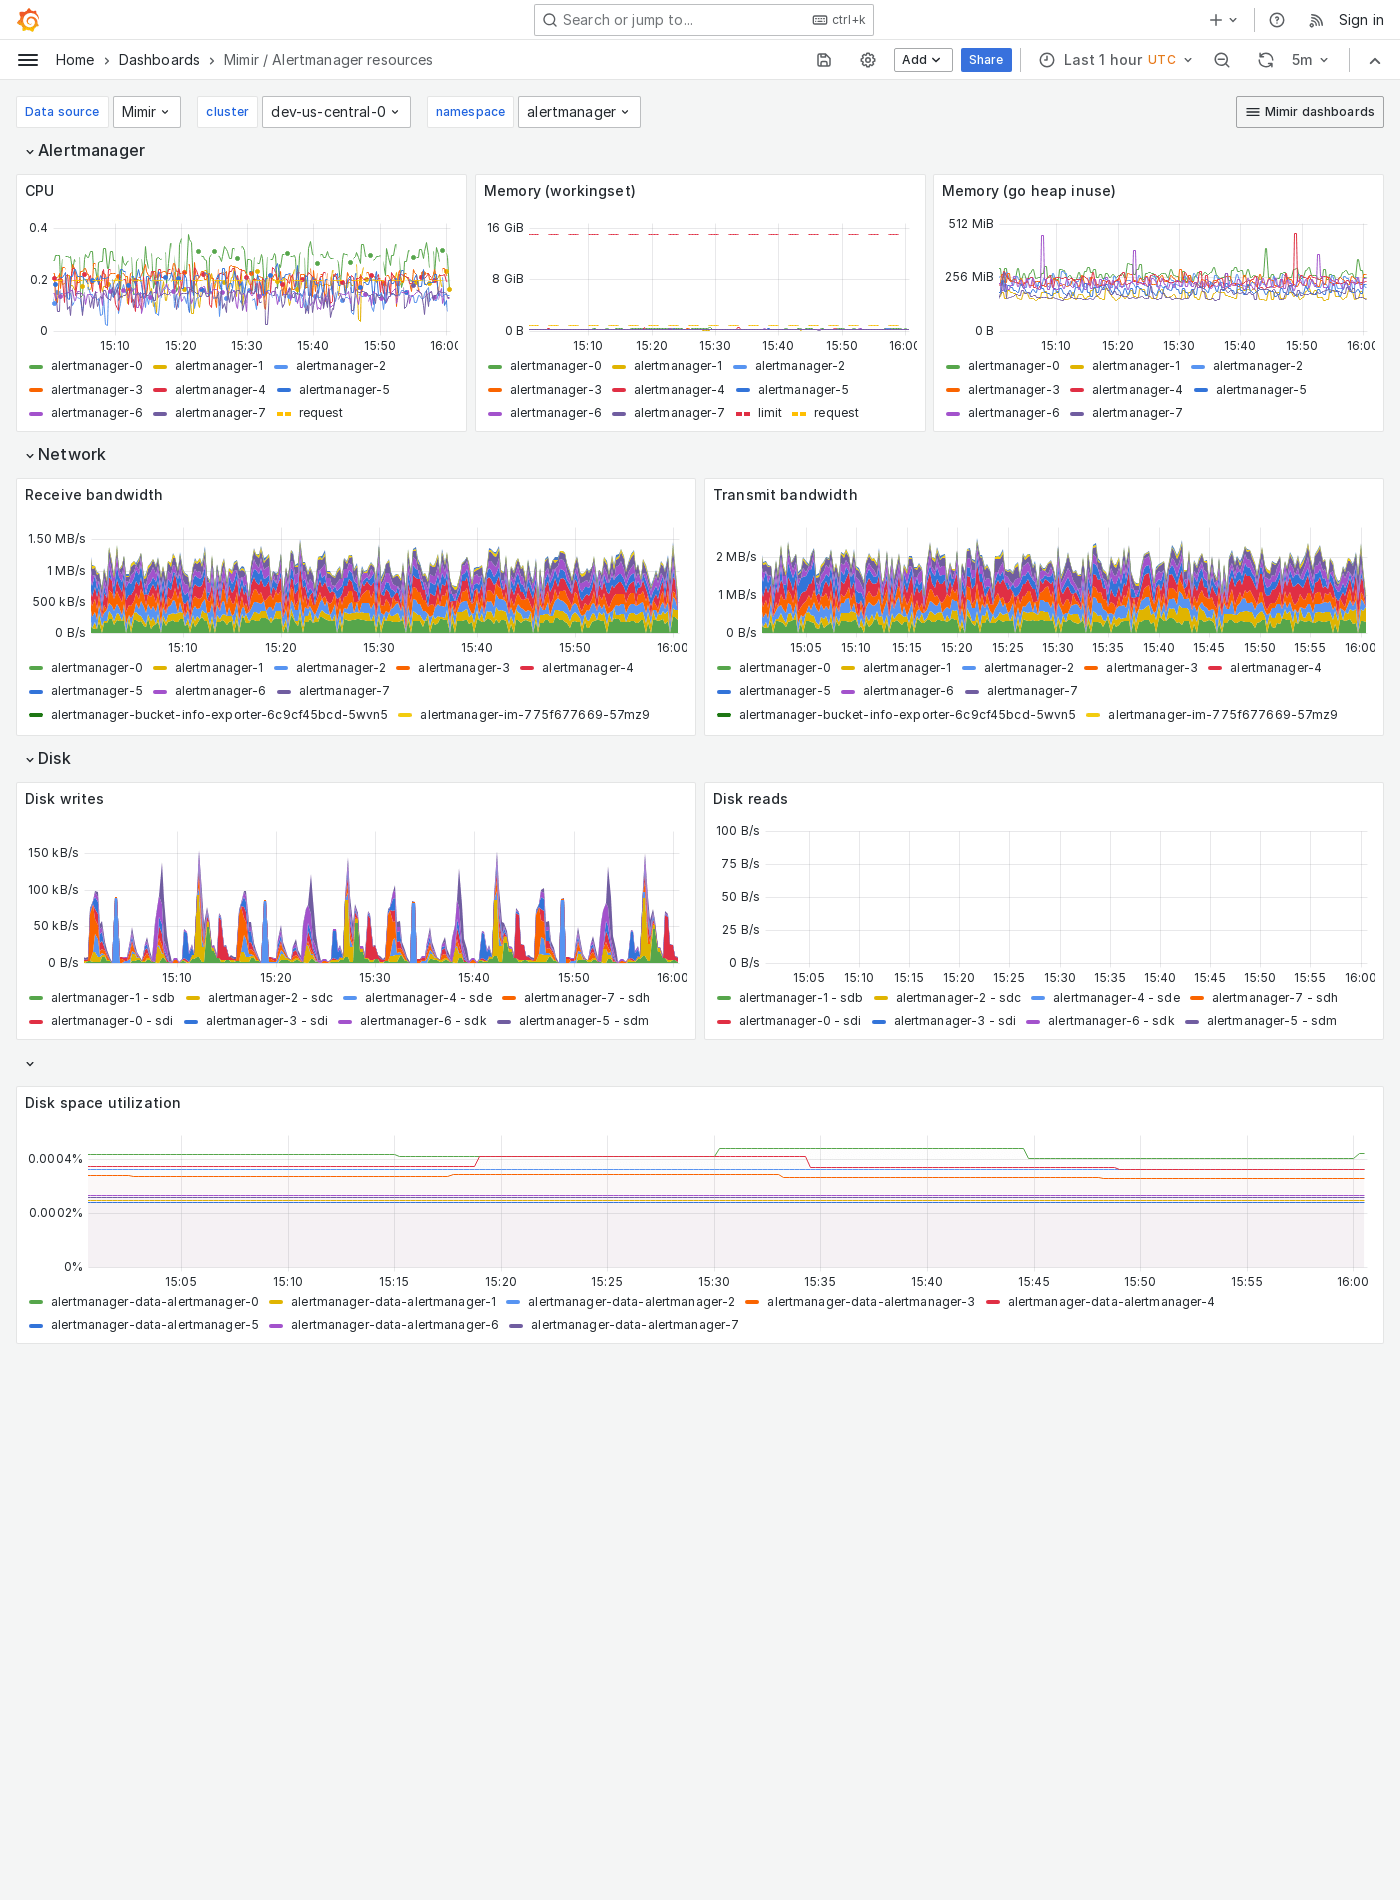
The Alertmanager resources dashboard shows CPU, memory, disk, and networking metrics for the Alertmanager.
Use this dashboard for the following use cases:
- Ensure the Alertmanager’s performance and reliability across a multi-tenant Mimir cluster.
- Monitor resource consumption in real time.
- Plan future resouce allocation needs.
This dashboard requires additional resources metrics.
Example
The following example shows an Alertmanager resources dashboard from a demo cluster.

Was this page helpful?
Related resources from Grafana Labs

