
Menu
Important: This documentation is about an older version. It's relevant only to the release noted, many of the features and functions have been updated or replaced. Please view the current version.
Open source
Grafana Mimir Alertmanager dashboard
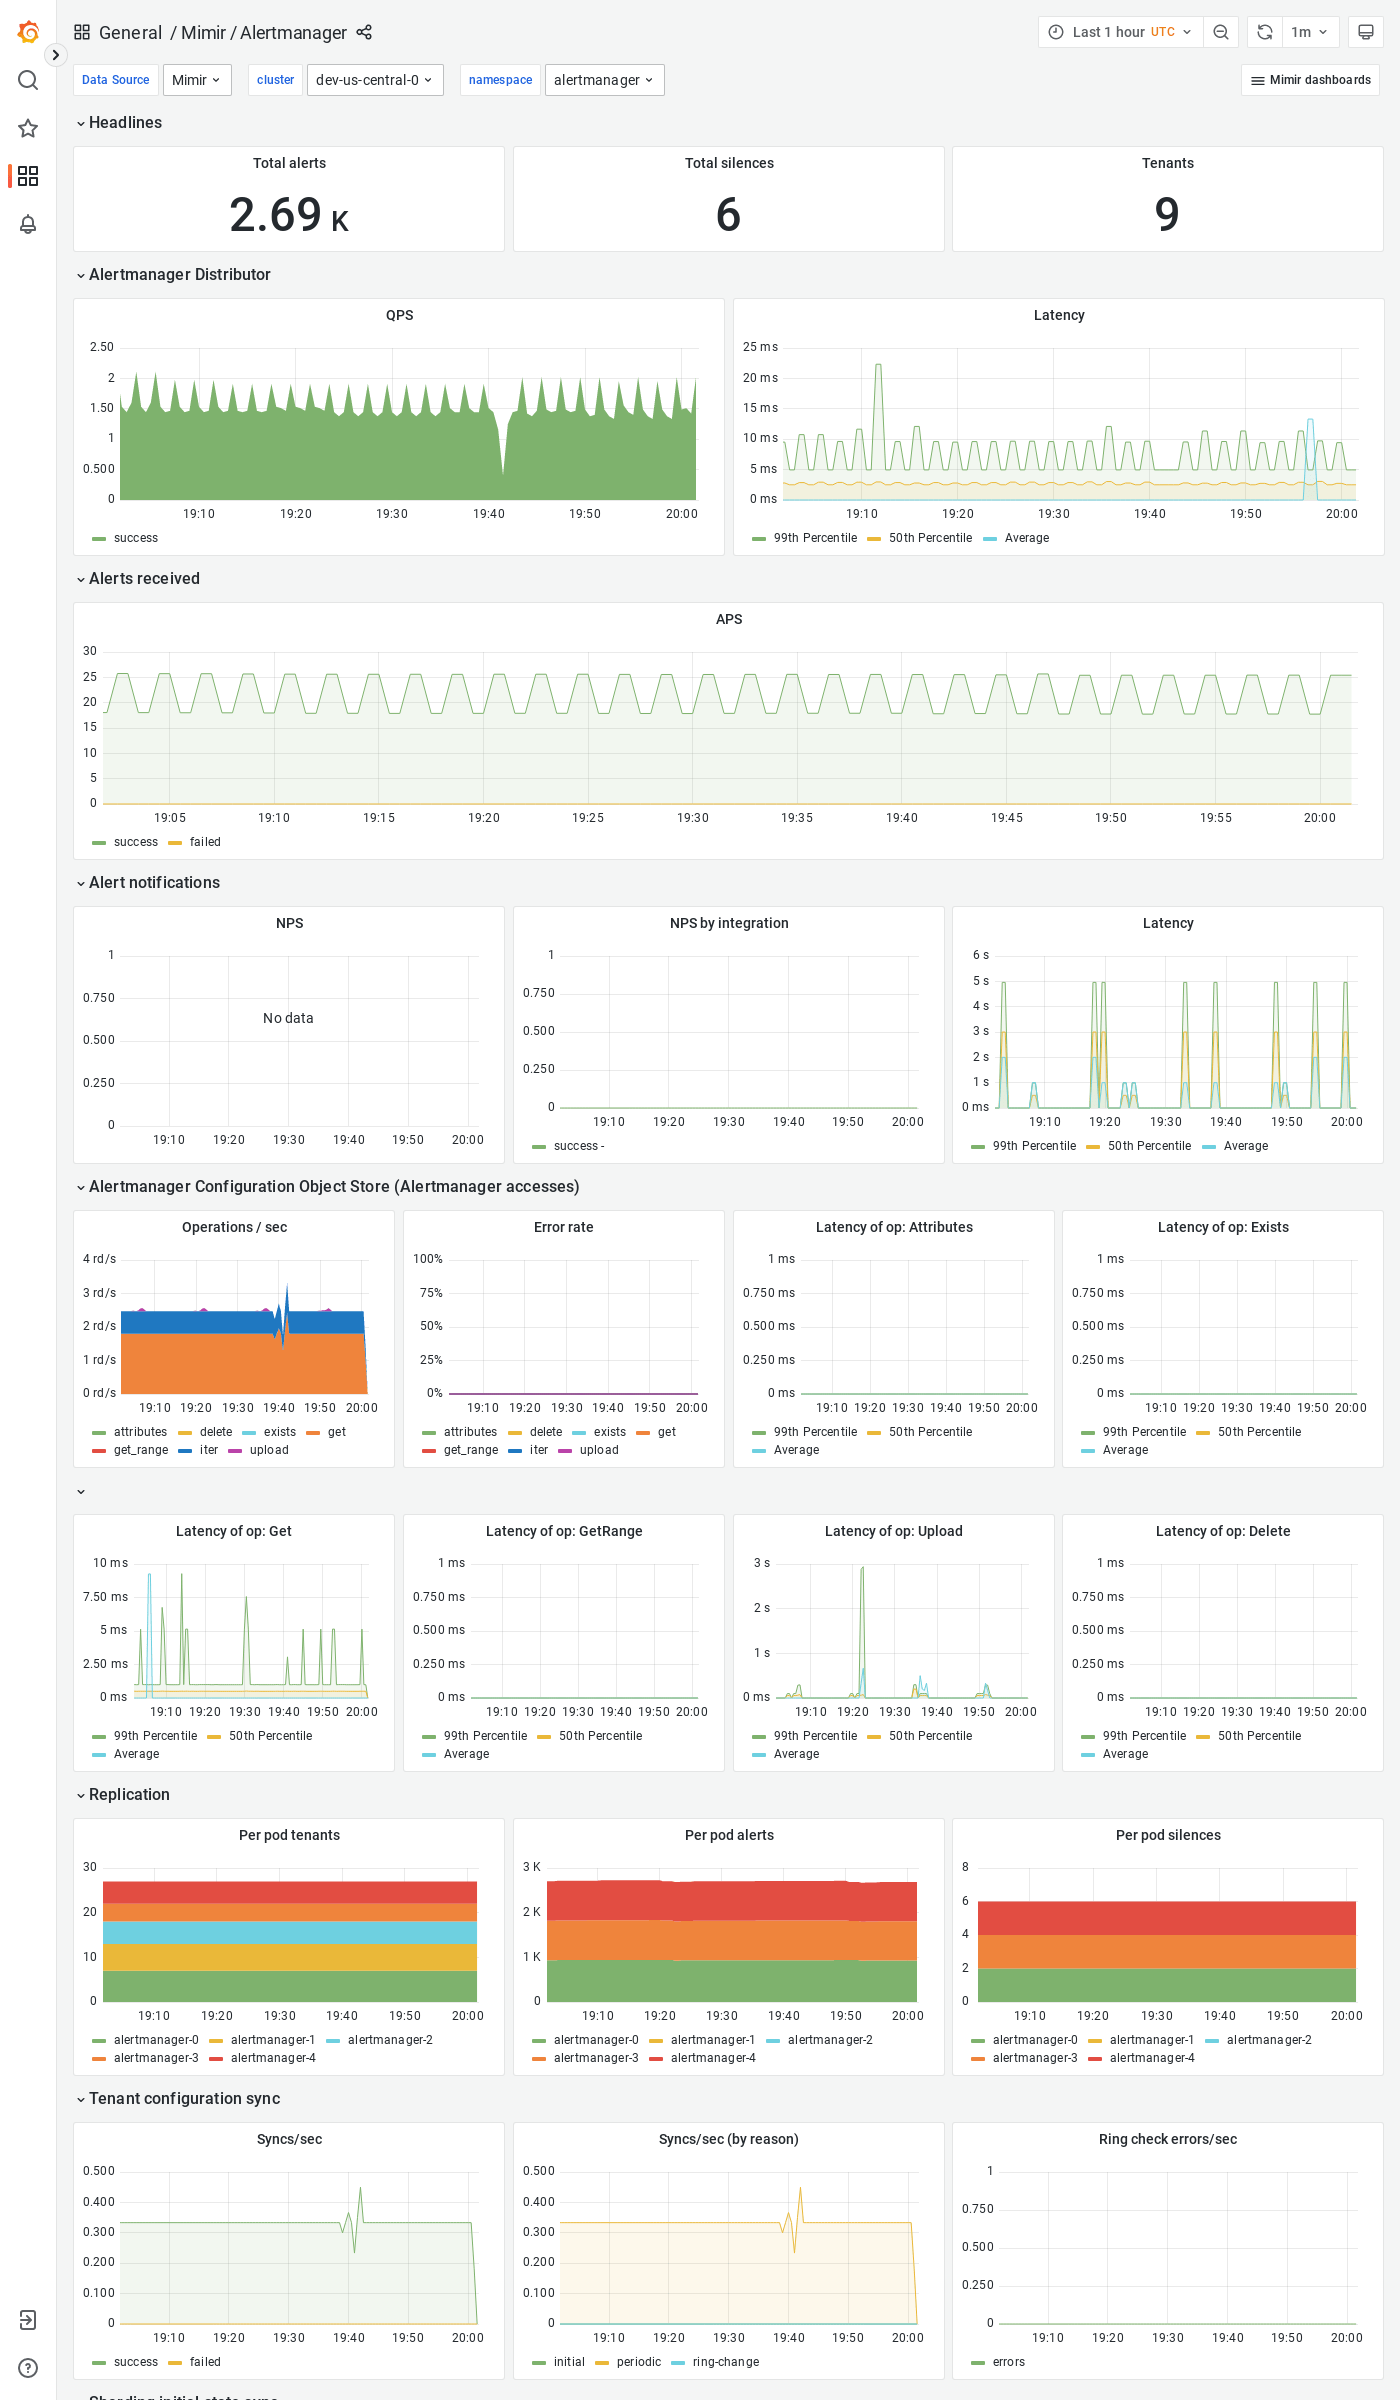
The Alertmanager dashboard shows health and activity metrics for the Alertmanager, and object storage metrics for operations triggered by the Alertmanager.
Example
The following example shows an Alertmanager dashboard from a demo cluster.
Was this page helpful?
Related resources from Grafana Labs

Intro to metrics with Grafana: Prometheus, Grafana Mimir, and beyond
In this webinar, we’ll go over challenges when scaling metrics systems, with a particular focus on Prometheus and Grafana Mimir.

Scaling and securing your Prometheus metrics in Grafana Cloud
In this webinar, we’ll go over Grafana Enterprise Metrics (GEM), a simple and scalable Prometheus service that is seamless to use, and simple to maintain

Less is more: How Grafana Mimir queries run faster and more cost efficiently with fewer indexes
By avoiding inverted index lookups in the Prometheus TSDB, Mimir's memory usage was reduced by up to 64%.