Menu
This is documentation for the next version of Grafana Mimir documentation. For the latest stable release, go to the latest version.
Open source
Grafana Mimir Overview dashboard
The Overview dashboard shows health and status of a Mimir cluster. This dashboard gives a high-level view of the entire Mimir cluster, and provides links to drill down into specific dashboards.
Use this dashboard for the following use cases:
- Monitor a Mimir cluster’s health in real-time.
- Gain insight into the different components in a cluster.
- Integrate alerting into your operations.
- Track resource utilization.
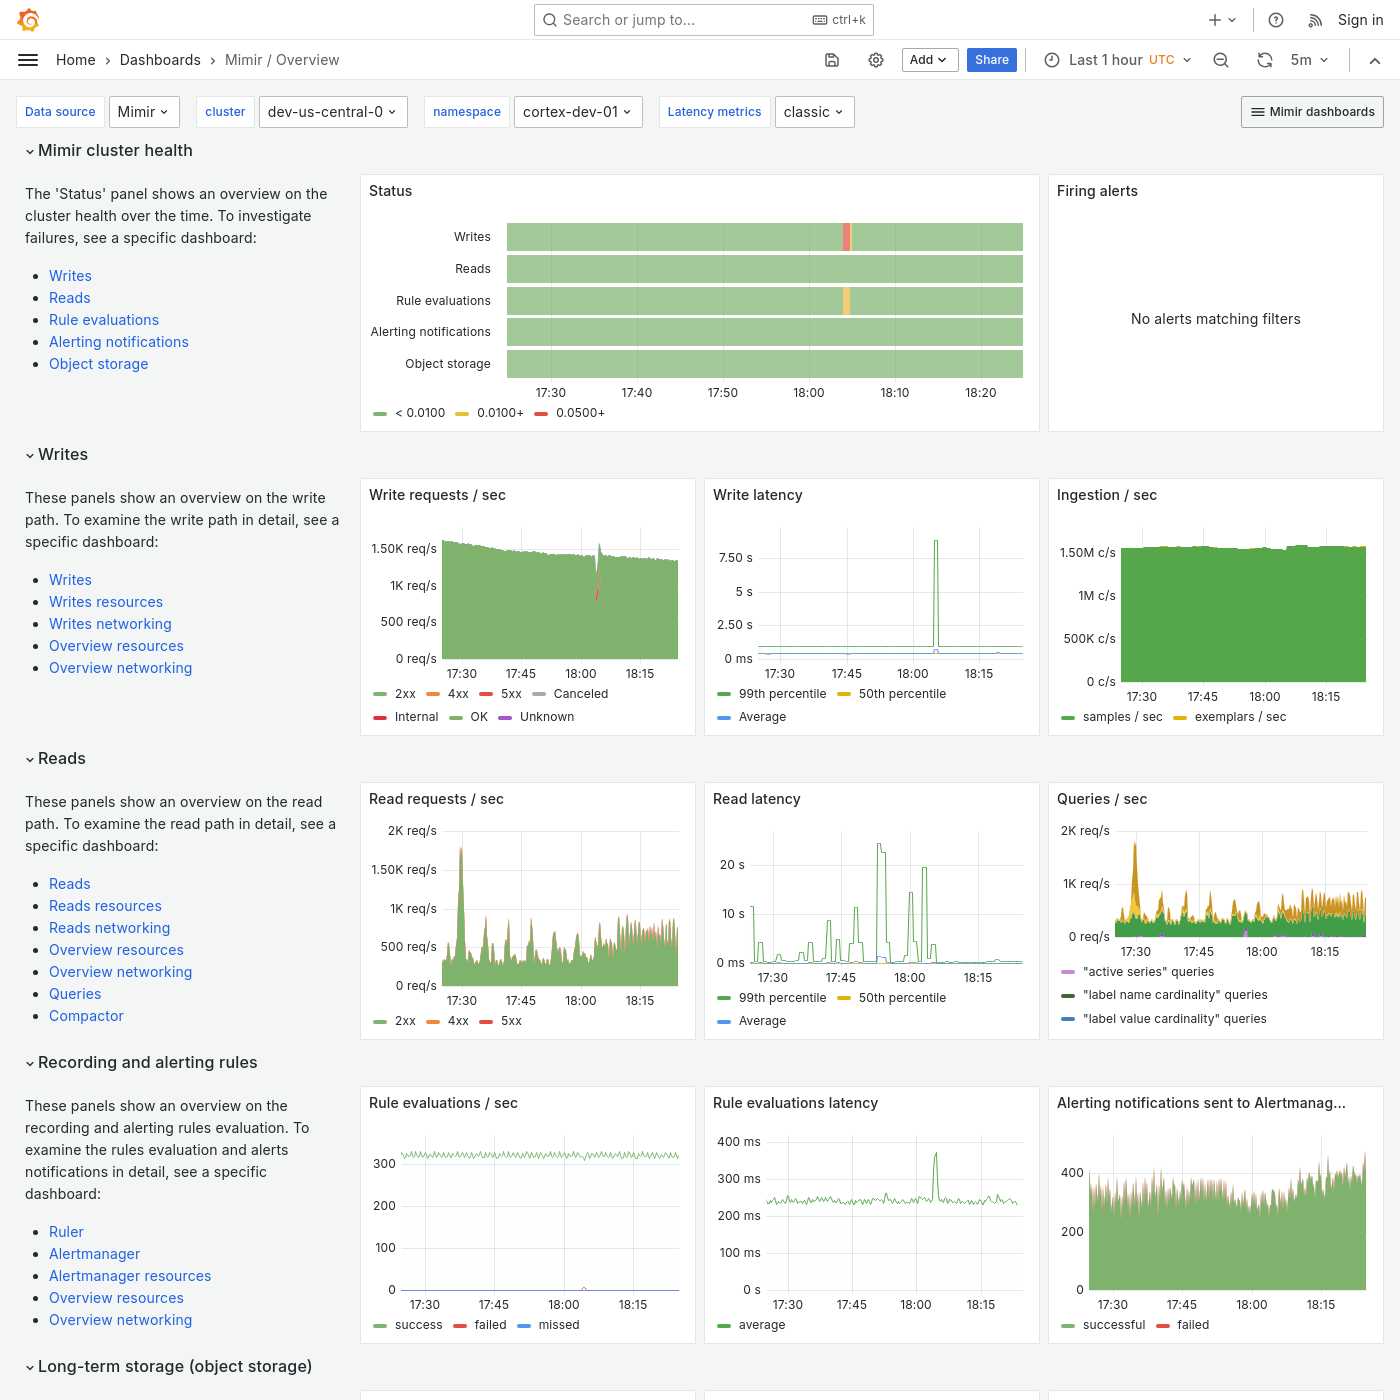
Example
The following example shows an Overview dashboard from a demo cluster.