Quickstart to run Loki locally
If you want to experiment with Loki, you can run Loki locally using the Docker Compose file that ships with Loki. It runs Loki in a monolithic deployment mode and includes a sample application to generate logs.
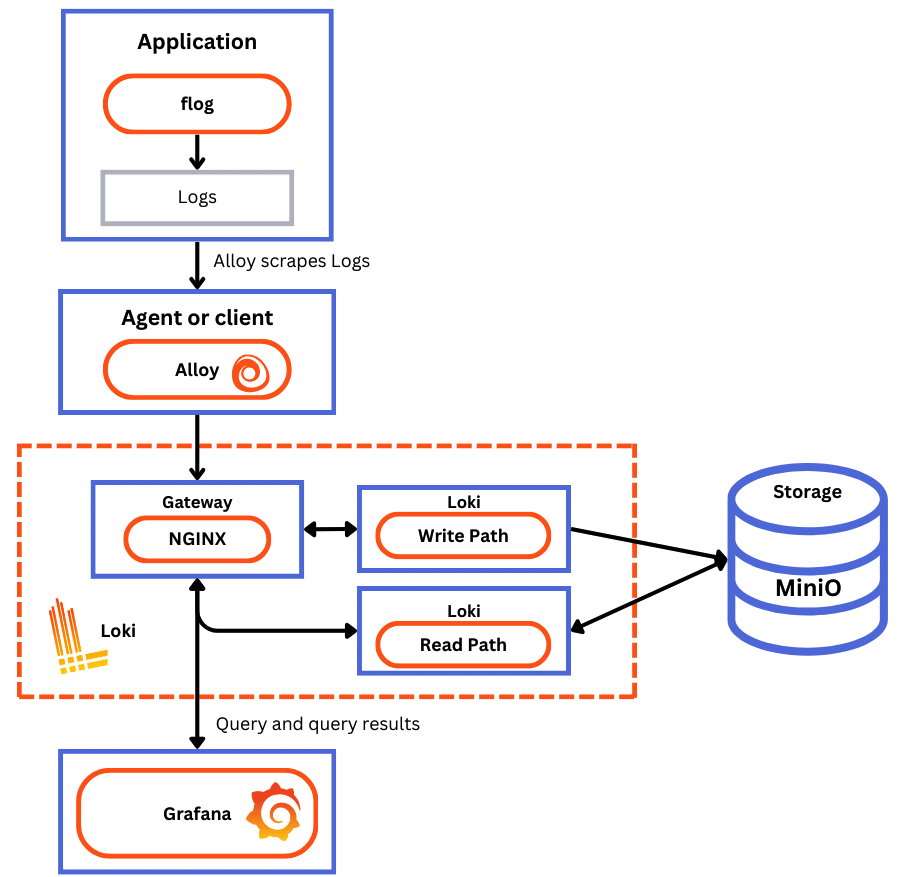
The Docker Compose configuration runs the following components, each in its own container:
flog: which generates log lines. flog is a log generator for common log formats.
Grafana Alloy: which scrapes the log lines from flog, and pushes them to Loki through the gateway.
Gateway (nginx) which receives requests and redirects them to the appropriate container based on the request’s URL.
Loki read component: which runs a Query Frontend and a Querier.
Loki write component: which runs a Distributor and an Ingester.
Loki backend component: which runs an Index Gateway, Compactor, Ruler, Bloom Planner (experimental), Bloom Builder (experimental), and Bloom Gateway (experimental).
Minio: which Loki uses to store its index and chunks.
Grafana: which provides visualization of the log lines captured within Loki.
Before you begin
Before you start, you need to have the following installed on your local system:
- Install Docker
- Install Docker Compose
Tip
Alternatively, you can try out this example in our interactive learning environment: Loki Quickstart Sandbox.
It’s a fully configured environment with all the dependencies already installed.
Provide feedback, report bugs, and raise issues in the Grafana Killercoda repository.
Install Loki and collecting sample logs
Note
This quickstart assumes you are running Linux.
To install Loki locally, follow these steps:
Create a directory called
evaluate-lokifor the demo environment. Makeevaluate-lokiyour current working directory:mkdir evaluate-loki cd evaluate-lokiDownload
loki-config.yaml,alloy-local-config.yaml, anddocker-compose.yaml:wget https://raw.githubusercontent.com/grafana/loki/main/examples/getting-started/loki-config.yaml -O loki-config.yaml wget https://raw.githubusercontent.com/grafana/loki/main/examples/getting-started/alloy-local-config.yaml -O alloy-local-config.yaml wget https://raw.githubusercontent.com/grafana/loki/main/examples/getting-started/docker-compose.yaml -O docker-compose.yamlcurl https://raw.githubusercontent.com/grafana/loki/main/examples/getting-started/loki-config.yaml --output loki-config.yaml curl https://raw.githubusercontent.com/grafana/loki/main/examples/getting-started/alloy-local-config.yaml --output alloy-local-config.yaml curl https://raw.githubusercontent.com/grafana/loki/main/examples/getting-started/docker-compose.yaml --output docker-compose.yamlDeploy the sample Docker image.
With
evaluate-lokias the current working directory, start the demo environment usingdocker compose:docker compose up -dAt the end of the command, you should see something similar to the following:
✔ Network evaluate-loki_loki          Created      0.1s
✔ Container evaluate-loki-minio-1     Started      0.6s
✔ Container evaluate-loki-flog-1      Started      0.6s
✔ Container evaluate-loki-backend-1   Started      0.8s
✔ Container evaluate-loki-write-1     Started      0.8s
✔ Container evaluate-loki-read-1      Started      0.8s
✔ Container evaluate-loki-gateway-1   Started      1.1s
✔ Container evaluate-loki-grafana-1   Started      1.4s
✔ Container evaluate-loki-alloy-1     Started      1.4s
(Optional) Verify that the Loki cluster is up and running.
- The read component returns
readywhen you browse to http://localhost:3101/ready. The messageQuery Frontend not ready: not ready: number of schedulers this worker is connected to is 0shows until the read component is ready. - The write component returns
readywhen you browse to http://localhost:3102/ready. The messageIngester not ready: waiting for 15s after being readyshows until the write component is ready.
- The read component returns
(Optional) Verify that Grafana Alloy is running.
- You can access the Grafana Alloy UI at http://localhost:12345.
(Optional) You can check all the containers are running by running the following command:
docker ps -a
View your logs in Grafana
After you have collected logs, you will want to view them. You can view your logs using the command line interface, LogCLI, but the easiest way to view your logs is with Grafana.
Use Grafana to query the Loki data source.
The test environment includes Grafana, which you can use to query and observe the sample logs generated by the flog application.
You can access the Grafana cluster by browsing to http://localhost:3000.
The Grafana instance in this demonstration has a Loki data source already configured.
![Grafana Explore Grafana Explore]()
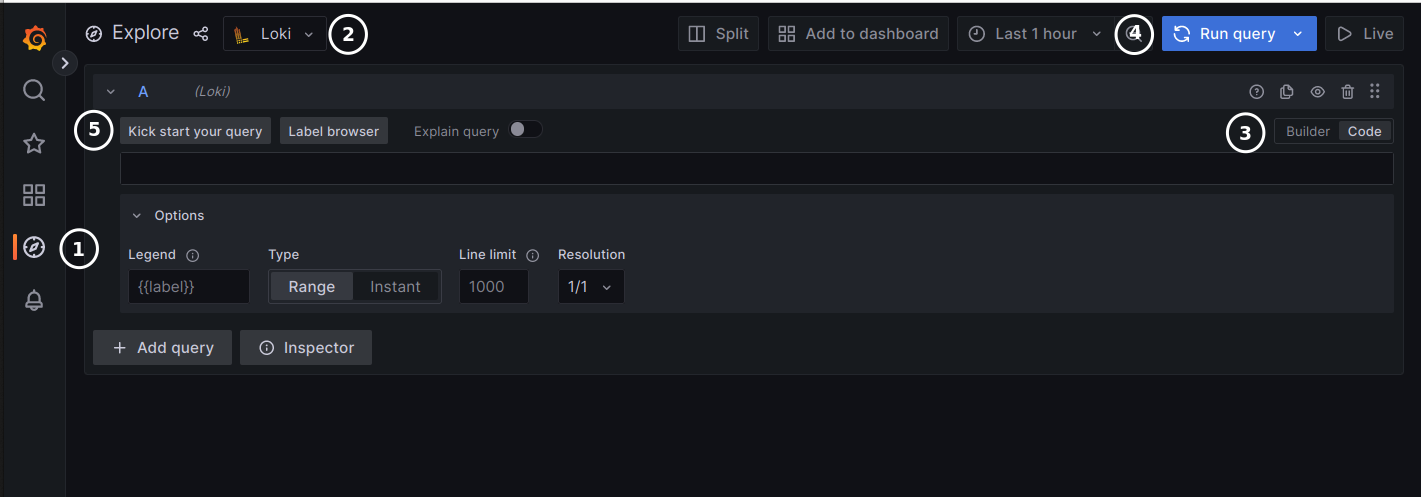
Grafana Explore From the Grafana main menu, click the Explore icon (1) to open the Explore tab.
To learn more about Explore, refer to the Explore documentation.
From the menu in the dashboard header, select the Loki data source (2).
This displays the Loki query editor.
In the query editor you use the Loki query language, LogQL, to query your logs. To learn more about the query editor, refer to the query editor documentation.
The Loki query editor has two modes (3):
- Builder mode, which provides a visual query designer.
- Code mode, which provides a feature-rich editor for writing LogQL queries.
Next we’ll walk through a few simple queries using both the builder and code views.
Click Code (3) to work in Code mode in the query editor.
Here are some sample queries to get you started using LogQL. These queries assume that you followed the instructions to create a directory called
evaluate-loki.If you installed in a different directory, you’ll need to modify these queries to match your installation directory.
After copying any of these queries into the query editor, click Run Query (4) to execute the query.
View all the log lines which have the container label
evaluate-loki-flog-1:{container="evaluate-loki-flog-1"}In Loki, this is a log stream.
Loki uses labels as metadata to describe log streams.
Loki queries always start with a label selector. In the previous query, the label selector is
{container="evaluate-loki-flog-1"}.To view all the log lines which have the container label
evaluate-loki-grafana-1:{container="evaluate-loki-grafana-1"}Find all the log lines in the
{container="evaluate-loki-flog-1"}stream that contain the stringstatus:{container="evaluate-loki-flog-1"} |= `status`Find all the log lines in the
{container="evaluate-loki-flog-1"}stream where the JSON fieldstatushas the value404:{container="evaluate-loki-flog-1"} | json | status=`404`Calculate the number of logs per second where the JSON field
statushas the value404:sum by(container) (rate({container="evaluate-loki-flog-1"} | json | status=`404` [$__auto]))
The final query is a metric query which returns a time series. This makes Grafana draw a graph of the results.
You can change the type of graph for a different view of the data. Click Bars to view a bar graph of the data.
Click the Builder tab (3) to return to builder mode in the query editor.
- In builder mode, click Kick start your query (5).
- Expand the Log query starters section.
- Select the first choice, Parse log lines with logfmt parser, by clicking Use this query.
- On the Explore tab, click Label browser, in the dialog select a container and click Show logs.
For a thorough introduction to LogQL, refer to the LogQL reference.
Sample queries (code view)
Here are some more sample queries that you can run using the Flog sample data.
To see all the log lines that flog has generated, enter the LogQL query:
{container="evaluate-loki-flog-1"}The flog app generates log lines for simulated HTTP requests.
To see all GET log lines, enter the LogQL query:
{container="evaluate-loki-flog-1"} |= "GET"To see all POST methods, enter the LogQL query:
{container="evaluate-loki-flog-1"} |= "POST"To see every log line with a 401 status (unauthorized error), enter the LogQL query:
{container="evaluate-loki-flog-1"} | json | status="401"To see every log line that doesn’t contain the text 401:
{container="evaluate-loki-flog-1"} != "401"For more examples, refer to the query documentation.
Loki data source in Grafana
In this example, the Loki data source is already configured in Grafana. This can be seen within the docker-compose.yaml file:
  grafana:
    image: grafana/grafana:latest
    environment:
      - GF_PATHS_PROVISIONING=/etc/grafana/provisioning
      - GF_AUTH_ANONYMOUS_ENABLED=true
      - GF_AUTH_ANONYMOUS_ORG_ROLE=Admin
    depends_on:
      - gateway
    entrypoint:
      - sh
      - -euc
      - |
        mkdir -p /etc/grafana/provisioning/datasources
        cat <<EOF > /etc/grafana/provisioning/datasources/ds.yaml
        apiVersion: 1
        datasources:
          - name: Loki
            type: loki
            access: proxy
            url: http://gateway:3100
            jsonData:
              httpHeaderName1: "X-Scope-OrgID"
            secureJsonData:
              httpHeaderValue1: "tenant1"
        EOF
        /run.sh
Within the entrypoint section, the Loki data source is configured with the following details:
Name: Loki(name of the data source)Type: loki(type of data source)Access: proxy(access type)URL: http://gateway:3100(URL of the Loki data source. Loki uses an nginx gateway to direct traffic to the appropriate component)jsonData.httpHeaderName1: "X-Scope-OrgID"(header name for the organization ID)secureJsonData.httpHeaderValue1: "tenant1"(header value for the organization ID)
It is important to note when Loki is configured in any other mode other than monolithic deployment, you are required to pass a tenant ID in the header. Without this, queries will return an authorization error.
Complete metrics, logs, traces, and profiling example
You have completed the Loki Quickstart demo. So where to go next?
If you would like to run a demonstration environment that includes Mimir, Loki, Tempo, and Grafana, you can use Introduction to Metrics, Logs, Traces, and Profiling in Grafana. It’s a self-contained environment for learning about Mimir, Loki, Tempo, and Grafana.
The project includes detailed explanations of each component and annotated configurations for a single-instance deployment. You can also push the data from the environment to Grafana Cloud.


