
Inspect configuration and trace flow
In this milestone, you examine your Grafana Alloy configuration to understand how traces flow through the pipeline and verify that trace processing is working correctly.
Your applications can send traces to Alloy, which forwards them to Grafana Cloud. The traces are delivered using the OpenTelemetry Protocol over HTTP to the configured endpoint.
Alloy provides a web interface that you can use to inspect the components used in your configuration and their status.
To inspect your configuration and verify trace flow, complete the following steps:
Restart Alloy to activate your configuration:
Linux
sudo systemctl reload alloymacOS
brew services restart grafana/grafana/alloyWindows
Open the Windows Services manager:
- Right click on the Start Menu and select Run.
- Type
services.mscand click OK. - Right click on the service called Alloy.
- Click on All Tasks > Restart.
Docker
Restart Docker container named grafana-alloy:
docker restart grafana-alloyOpen your web browser and navigate to
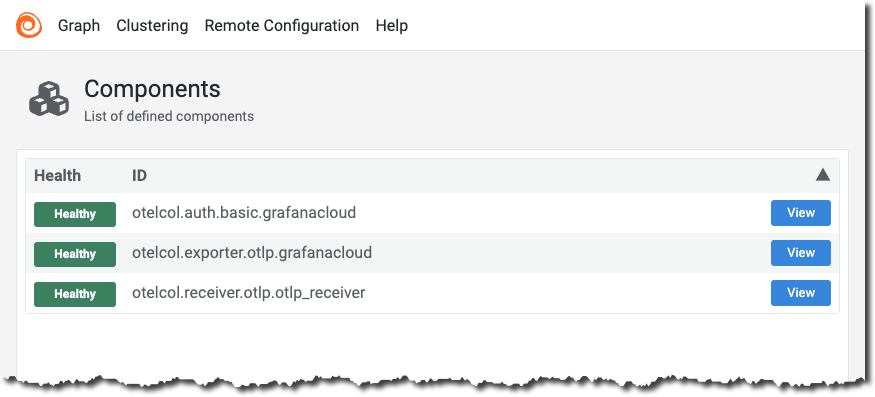
http://localhost:12345to access the Alloy web interface.The web UI shows the status of each component, including the
otelcol.receiver.otlpandotelcol.exporter.otlpcomponents.![Grafana Alloy web interface showing the status of components including the otelcol.receiver.otlp and otelcol.exporter.otlp components.]()
In the Alloy web UI, select
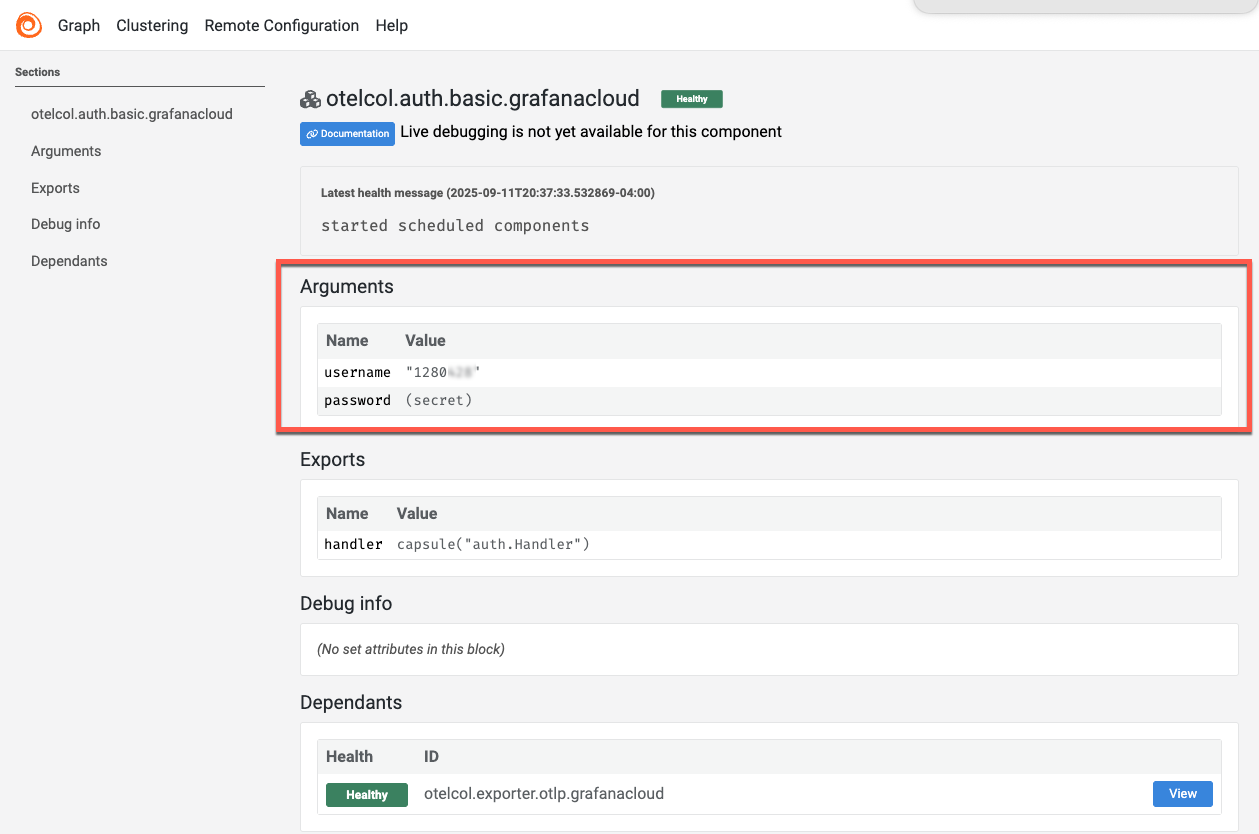
otelcol.auth.basic.grafanacloudfrom the Components list.Under the Arguments section, verify that the
usernamefield matches your Grafana Cloud instance ID.If the username is incorrect, update it in your configuration file and restart the Alloy service.
![Grafana Alloy web interface showing the otelcol.auth.basic.grafanacloud component with the username field under Arguments.]()
In the next milestone, you view and analyze the traces in Grafana Cloud to complete your observability setup.