Review related logs
In this milestone, you examine log data from the incident timeframe to identify error messages and patterns.
In RCA Workbench, logs are accessed through the Timeline view, providing instant log context for any point in your investigation. The logs are automatically pre-filtered by the selected entity and timestamp, with full Logs Drilldown capabilities that don’t require writing LogQL queries.
To review related logs, complete the following steps:
In RCA Workbench, locate the Timeline view.
Click a specific point in time on the Timeline where you want to investigate logs.
In the popup that appears, click Logs.
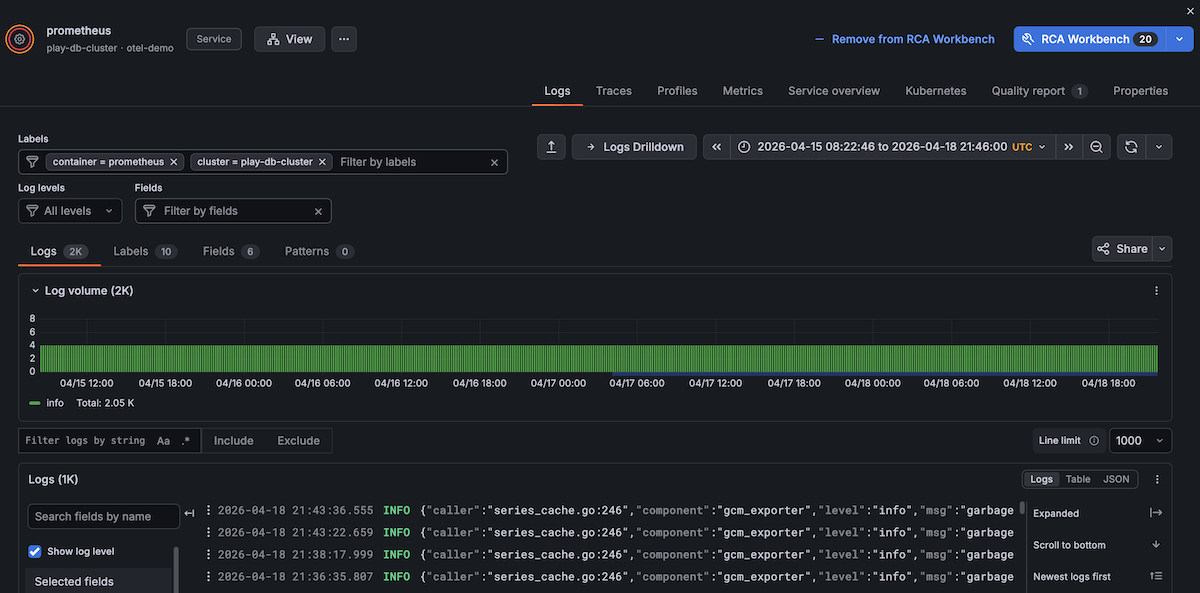
A drawer opens with the Logs tab showing contextualized Logs Drilldown.
The logs view includes the following features:
- Pre-filtered by the selected entity using labels like cluster, job, and namespace
- Filtered to the selected timestamp for focused investigation
- Full Logs Drilldown capabilities without requiring LogQL queries
- Search, filter, and pattern detection features
Review the log entries automatically filtered to the selected timeframe and entity.
Examine the log level distribution to identify error and warning concentrations.
Click on a log entry to view the full message and associated metadata.
Use the search field to filter logs for specific error codes or keywords.
For example, search for
errorortimeoutto find relevant error messages.Note any error patterns or repeated messages that coincide with the incident.
You can see log entries from the incident period with error-level messages highlighted, and the ability to search and filter for specific patterns.
In the next milestone, you’ll trace service dependencies to understand the impact scope.