Navigate to RCA Workbench
In this milestone, you access RCA Workbench to begin investigating incidents in Grafana Cloud.
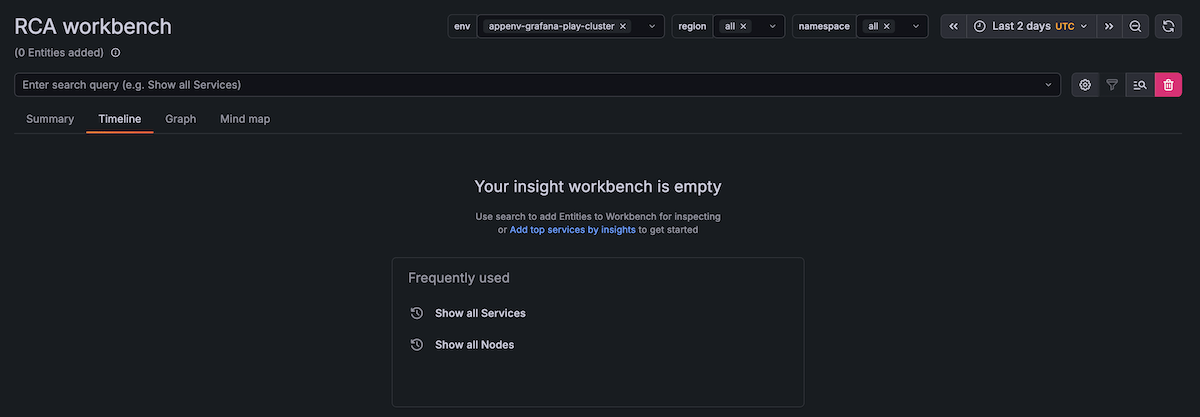
RCA Workbench provides a centralized interface for investigating incidents by correlating insights across multiple services and infrastructure components. The workbench displays a timeline view where you can see all insights firing across different entities, helping you identify root causes and understand the sequence of events.
To navigate to RCA Workbench, complete the following steps:
Sign in to your Grafana Cloud environment, for example
mystack.grafana.net.In the navigation menu, click Observability > RCA workbench.
RCA Workbench opens with an empty workspace.
Use the Frequently used menu to quickly add entities:
- Click Show all Services to add all discovered services
- Click Show all Nodes to add all infrastructure nodes
Alternatively, you can manually add specific entities in the next milestone.
RCA Workbench displays with a timeline ready to show insights across your selected entities.
In the next milestone, you’ll add specific entities to investigate and set the appropriate time range for your incident.