Explore the investigation timeline
In this milestone, you explore the RCA Workbench timeline to understand the sequence of insights and events during the incident.
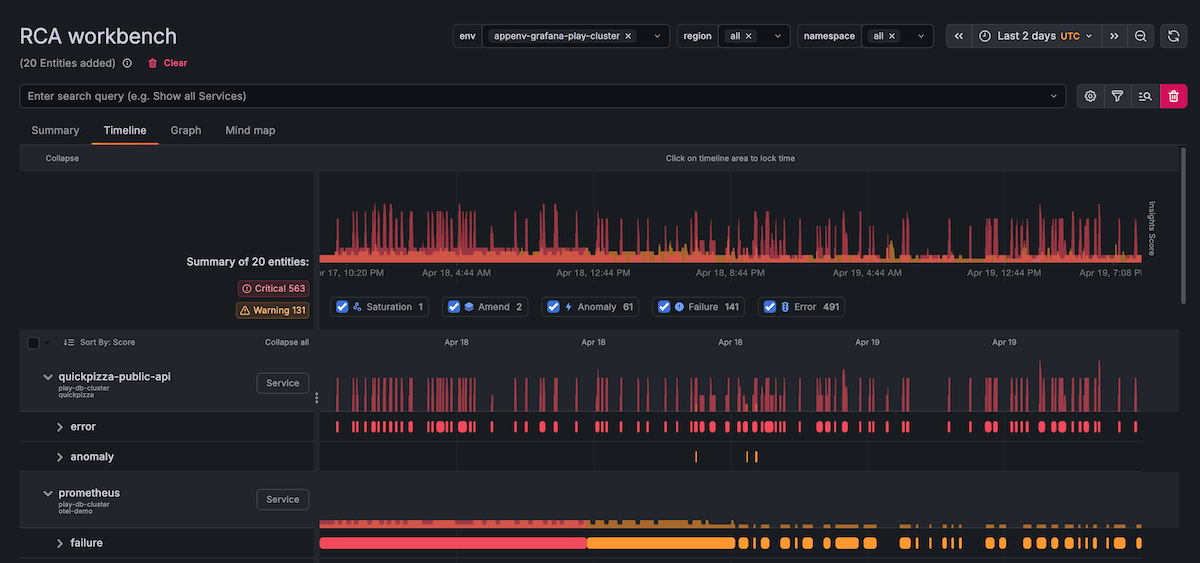
RCA Workbench timeline provides a chronological view of insights firing across your selected entities. This timeline view helps you identify the first failure, trace cascading effects, and understand how issues propagated through your system.
To explore the investigation timeline, complete the following steps:
In RCA Workbench, ensure you’re in the Timeline view.
Expand the entities on the left panel to show individual insights.
Scan the timeline from left to right to identify the earliest insight that fired.
Look for:
- Amend insights (blue) - Deployments or configuration changes
- Failure insights (red) - Service or infrastructure failures
- Saturation insights (yellow/red) - Resources approaching limits
Start with blue amend insights. A recent deployment or config change that immediately precedes red failure insights is one of the most common root causes. If no amend insights appear, look for the earliest saturation insight, which may indicate gradual resource exhaustion that eventually triggered failures.
Note the time of the first insight, as this is often the root cause or trigger.
Look for cascading failures by examining insights that fired shortly after the first one.
For example, if a saturation insight fires on a database node at 14:02 and failure insights begin appearing on upstream API services at 14:04, the database is likely the origin. A gap of seconds to a few minutes between the first insight and downstream failures is a common cascading pattern. If multiple unrelated entities show insights at the exact same time, the cause may be external, such as a network partition or a deployment rollout.
Click and drag on the timeline to zoom into specific time periods for detailed analysis.
You can see insights displayed chronologically across multiple entities, with the ability to identify the first failure and trace how it propagated through your system.
In the next milestone, you’ll analyze correlated metrics to identify performance degradation.