Add entities and set time range
In this milestone, you add specific entities to RCA Workbench and configure the time range for your investigation.
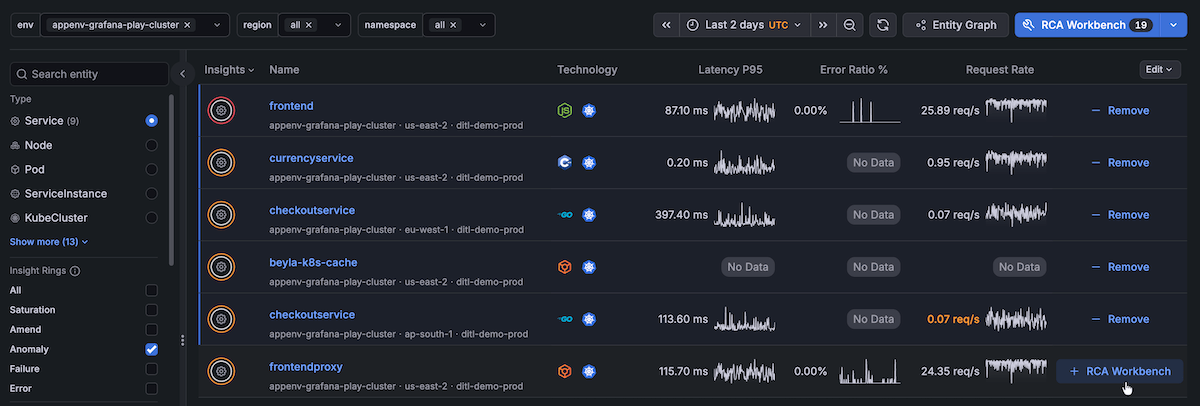
RCA Workbench becomes powerful when you populate it with the services and infrastructure components involved in your incident. By adding relevant entities and setting the appropriate time range, you can see how insights correlate across your environment and identify the root cause.
To add entities and set the time range, complete the following steps:
Open the entity catalog by navigating to Observability > Entity catalog.
Filter entities to find those relevant to your incident:
- Filter by Type to focus on services, pods, or nodes
- Use the Insight Rings filter to show entities with active issues
- Use the Environment (env) filter if you have multiple environments
![Entity catalog with filters applied showing services with active insights]()
Click an entity you want to investigate.
In the entity details panel, click Add to RCA workbench.
Repeat steps 3-4 for each entity you want to investigate.
You can add as many entities as needed. Focus on entities directly involved in the incident or those showing insights during the incident timeframe.
Return to RCA Workbench by navigating to Observability > RCA workbench.
Use the time picker in the upper right corner to set the investigation time window.
Select a time range that:
- Starts slightly before the incident symptoms appeared
- Extends past when the incident resolved (or to current time if ongoing)
Adjust the range as needed during your investigation.
A focused time range makes it easier to identify patterns and correlations on the timeline.
Tip: If you added too many entities, hover over an entity in the Timeline view’s left panel and click the X icon to remove it from the workbench.
In the next milestone, you’ll explore the timeline to understand the sequence of events during the incident.