Open in Grafana Cloud
Complete this learning path directly in your Grafana Cloud stack, or in the Grafana Play stack, with an interactive learning experience.
Investigate incidents using RCA Workbench
Welcome to the Grafana learning path that shows you how to use RCA Workbench to investigate incidents by correlating metrics, logs, and traces.
RCA Workbench is a unified investigation interface designed to accelerate incident resolution by automatically correlating telemetry data. It eliminates the need to manually switch between multiple dashboards and tools, providing investigators with all relevant context in one place.
Traditional incident investigation requires manually searching through metrics, logs, and traces across different tools to identify root causes. RCA Workbench streamlines this process by automatically correlating telemetry signals within the incident timeframe, reducing mean time to resolution (MTTR) and enabling faster problem identification.
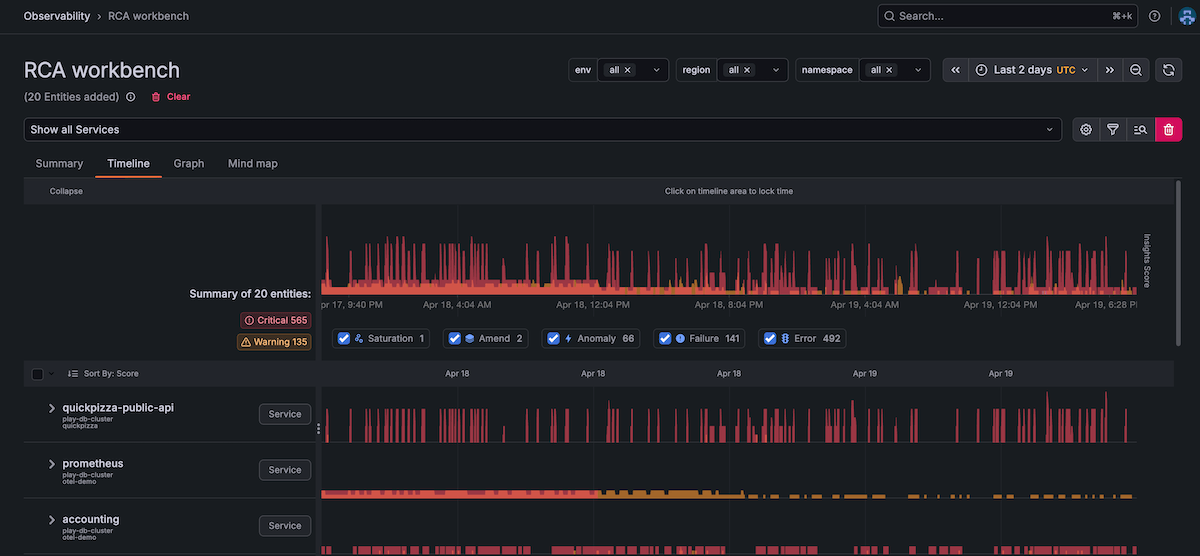
The screenshot below shows RCA Workbench populated for investigating an incident.
Here’s what to expect
When you complete this path, you’ll be able to:
- Understand the value of RCA Workbench for accelerating incident investigation
- Navigate to RCA Workbench in Grafana Cloud
- Add entities from the entity catalog to investigate
- Set appropriate time ranges for incident investigation
- Explore the investigation timeline to identify event correlations
- Analyze correlated metrics to spot performance degradation
- Review related logs to find error patterns and messages
- Trace service dependencies to understand incident impact scope
- Use Grafana Assistant to get AI-powered insights and root cause recommendations
Before you begin
Before you use RCA Workbench, ensure that you have:
- A Grafana Cloud account. To create an account, refer to Grafana Cloud.
- Services instrumented with OpenTelemetry, Application Observability, or Kubernetes monitoring.
- The knowledge graph enabled in your Grafana Cloud stack with entities discovered from your environment. To enable the Knowledge Graph, refer to Get started with the knowledge graph.
- An active incident or performance issue to investigate.
Troubleshooting
If you get stuck, we’ve got your back! Where appropriate, troubleshooting information is just a click away.
More to explore
We understand you might want to explore other capabilities not strictly on this path. We’ll provide you opportunities where it makes sense.