
Visualize the spike in Grafana Cloud k6
The end-of-test summary aggregates metrics across the entire run, which blends the spike with the calm periods. Grafana Cloud k6 shows a timeline of when the spike happened and how latency, errors, and throughput changed in each phase. Use the timeline to measure recovery time; the summary alone does not split metrics by phase.
To visualize your spike test in Grafana Cloud k6, complete the following steps:
If you haven’t already authenticated with Grafana Cloud k6, log in from the CLI:
k6 cloud login --token <YOUR_API_TOKEN> --stack <YOUR_STACK_SLUG_OR_URL>In Grafana Cloud, go to Testing & synthetics > Performance > Settings. Under Access, copy your Personal token or Stack token. For
--stack, pass your stack URL slug or full stack URL (for examplemy-teamorhttps://my-team.grafana.net). Refer to Authenticate on the CLI.Run the spike test with cloud output:
k6 cloud run --local-execution spike.jsThe
--local-executionflag runs the test on your machine while streaming results to Grafana Cloud k6 for storage and visualization, as described in Use the CLI. k6 prints a URL to the test result in Grafana Cloud.Note:
--local-executionruns the test on your machine and streams results to Grafana Cloud k6. It’s convenient for small tests like this one. For higher VU counts, your machine can become the bottleneck and skew the results; run the test on managed cloud load generators instead by dropping the flag:k6 cloud run spike.jsBoth commands use the same
spike.jsscript; only where k6 executes the test differs. Refer to Use the CLI.
Open the test result URL in your browser.
In the Grafana Cloud k6 test result, look at the Performance Overview section.
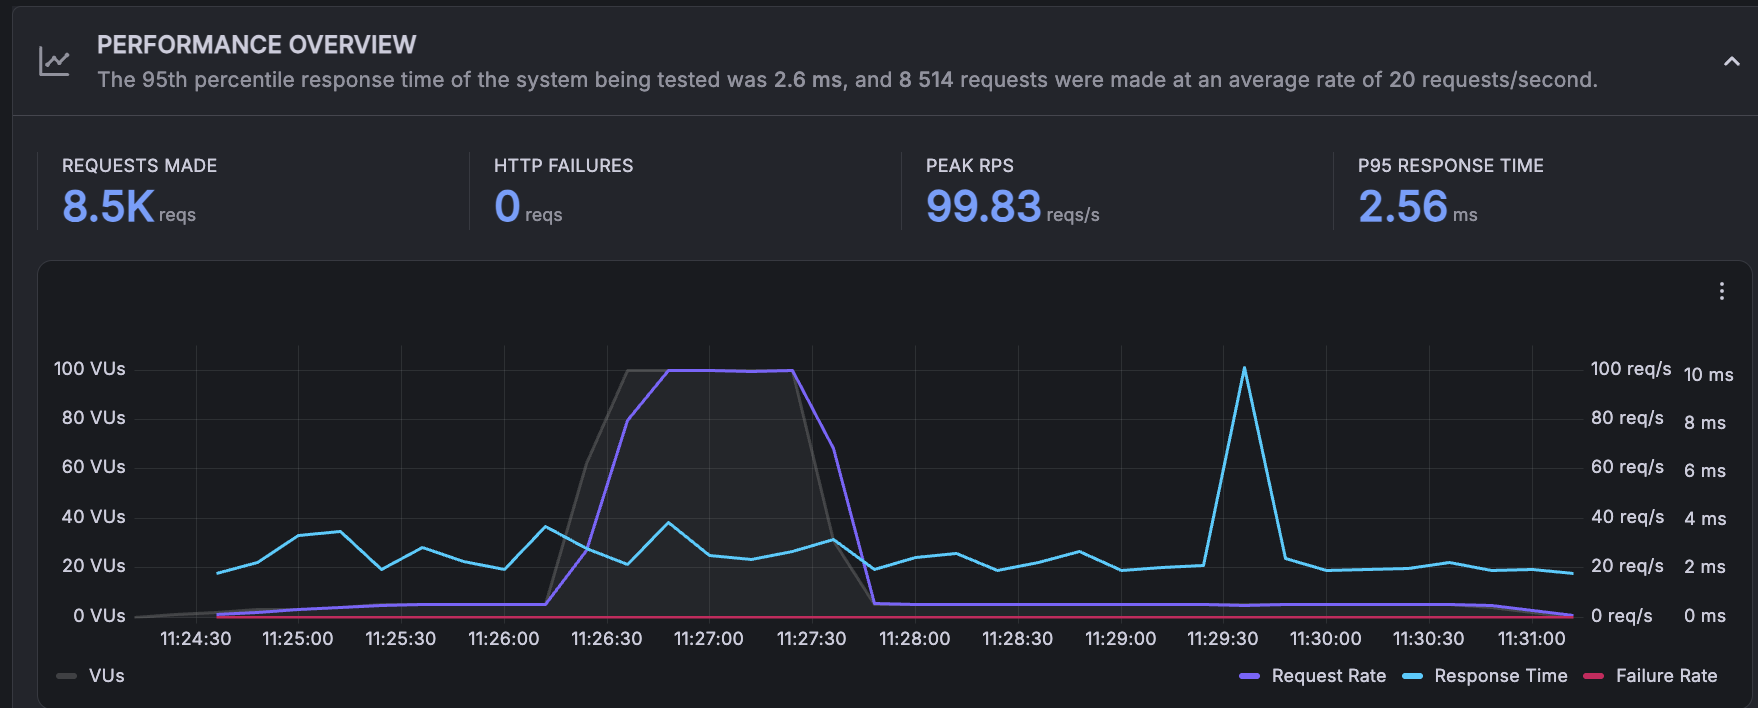
![Performance Overview timeline showing VU spike, request rate, response time, and zero failures during a k6 spike test]()
The VU count shows the spike shape: a flat line at 5, a sharp jump to 100, and a drop back to 5. When request rate and response time series are visible, request rate tracks the burst and response time shows whether latency changed during or after the spike.
Correlate the VU shape with the response time and throughput lines on the same chart.
Compare the response time across each phase of the test:
- Baseline phase (first two minutes): Confirm latency and throughput are stable. These are your reference values.
- Spike phase (the burst): Note whether response time stayed flat, rose proportionally, or spiked with errors when VUs jumped to 100.
- Recovery phase (three minutes after the spike): Compare post-spike response time to the baseline phase. A resilient system returns to baseline values within seconds.
Note: If the system handled the spike without any visible change in the timeline, that’s a valid result. It means the 20x spike didn’t exceed the system’s instantaneous capacity. You can increase the spike multiplier (for example, from 100 VUs to 200 or 500) and run again to find where the response changes.
In the next milestone, you document per-phase metrics and calculate recovery time from the timeline.