Add a Filter data by values transformation
The filter data by values transformation allows you to include or exclude rows based on specific values in one or more fields. It’s similar to the SQL WHERE clause. Use this transformation to selectively filter data points directly within your visualization. This transformation is very useful if your data source does not natively filter by values. You might also use this to narrow values to display if you are using a shared query.
To use the filter data by values transformation, complete the following steps:
Open your dashboard in edit mode.
Click Transformations tab and click + Add transformation button.
Select or search for Filter data by values.
On the Filter type, select if you want an include or exclude filter.
On the Condition, select if you want the filter type to match all conditions or just match any.
Use the following table as a guideline for when to use the different conditions.
The transformation should be applied automatically. If not, click Refresh to verify the visualization looks as intended.
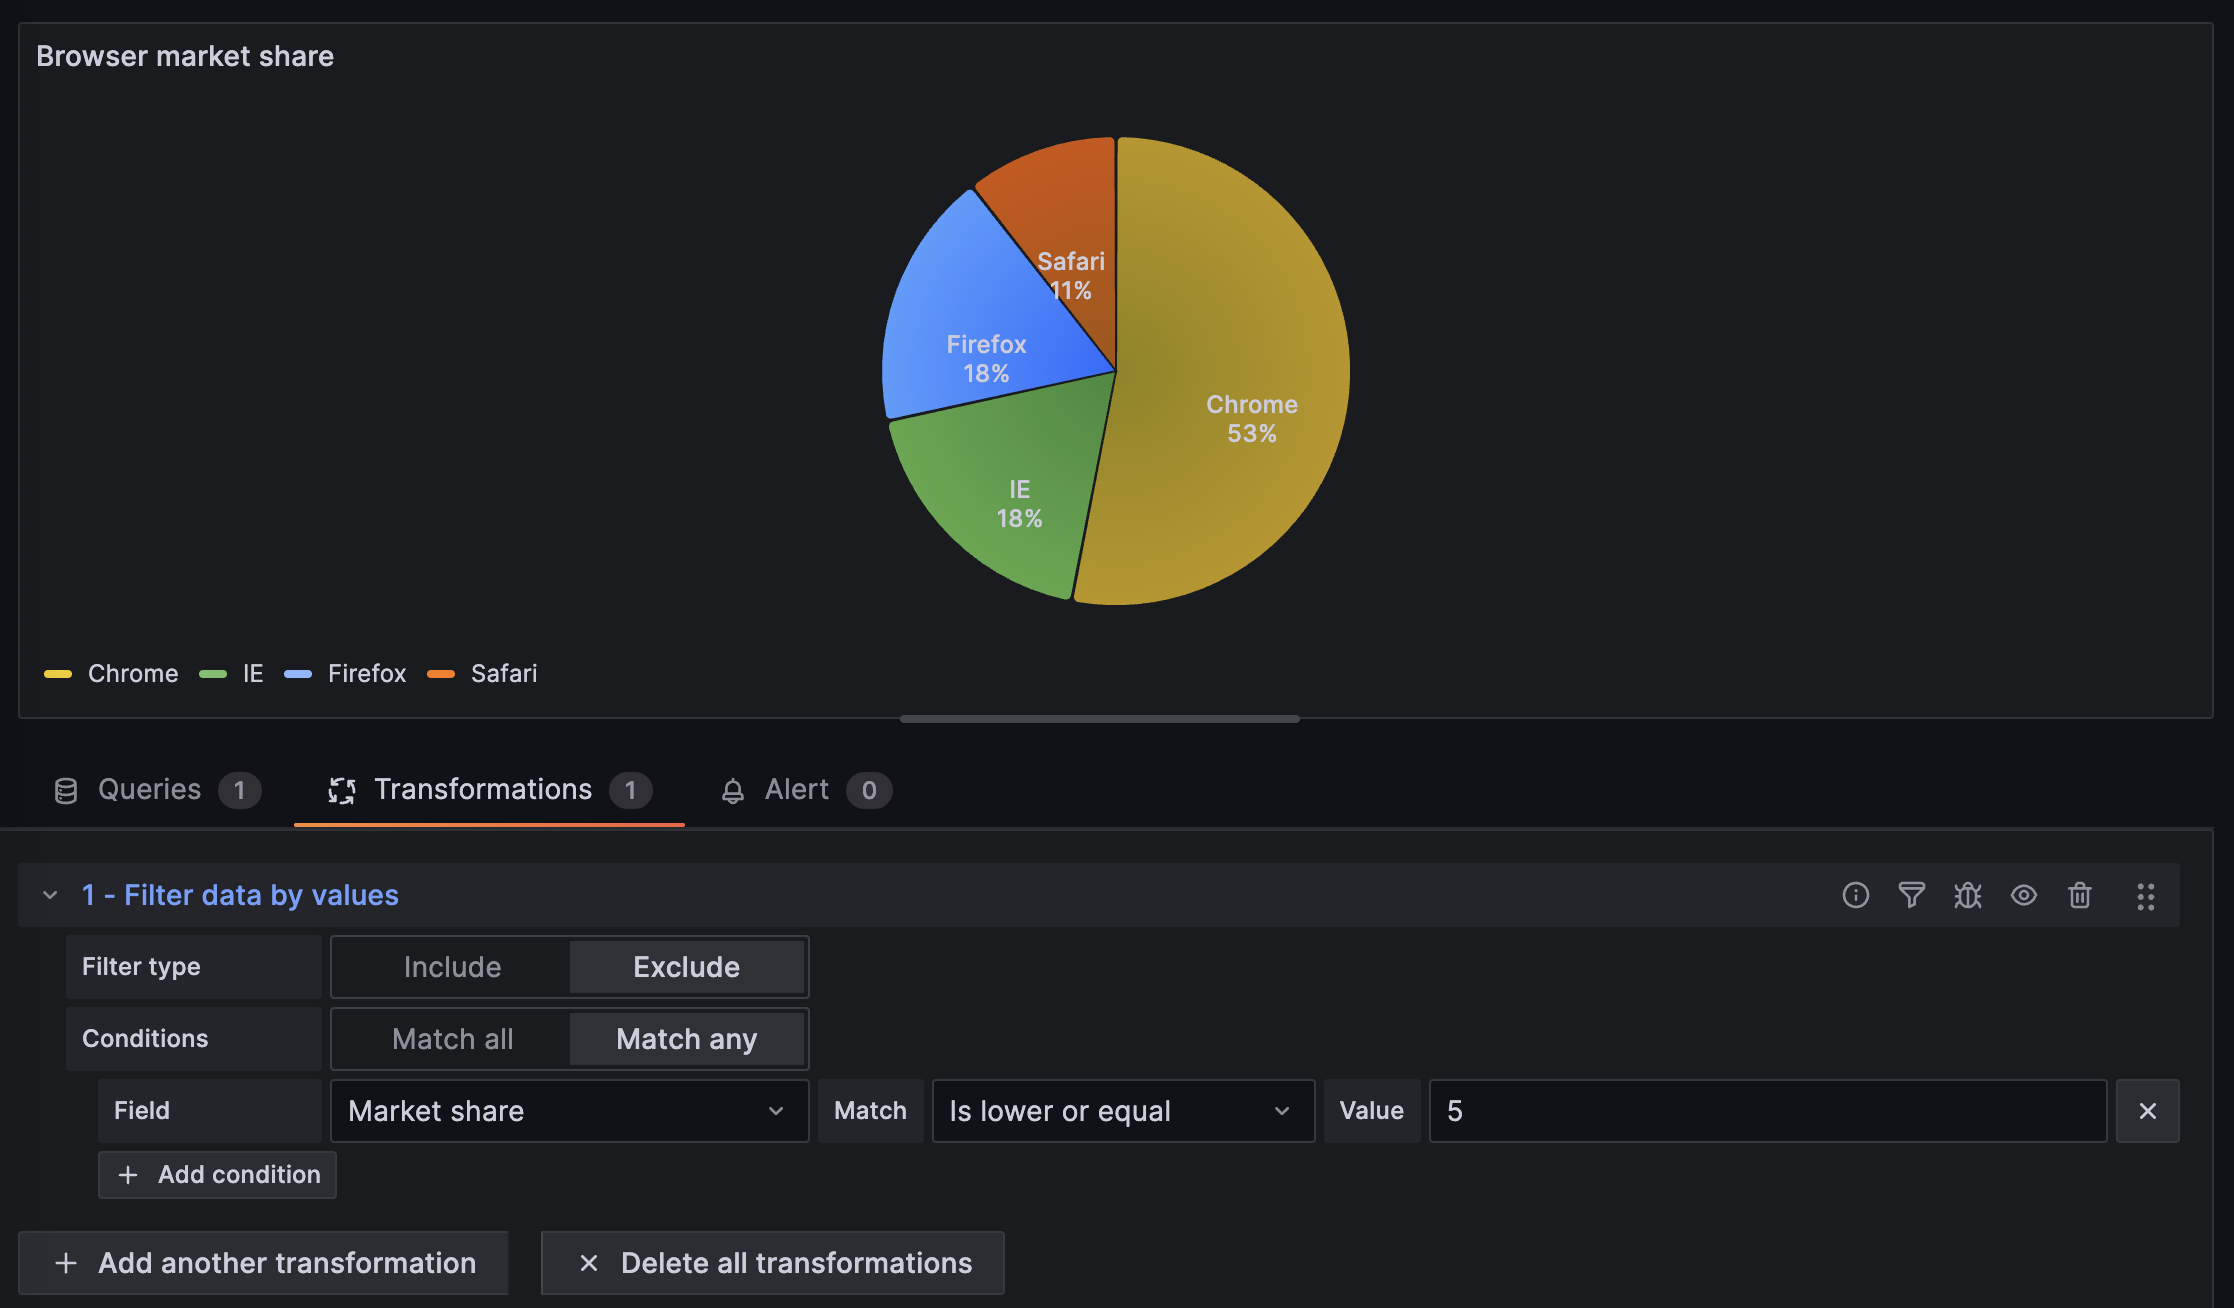
The following image shows a filter data by values transformation that excludes browsers with less than or equal to 5% market share.
![Browser market share visualization with Filter data by values transformation]()
Save your dashboard.